Service Auditing
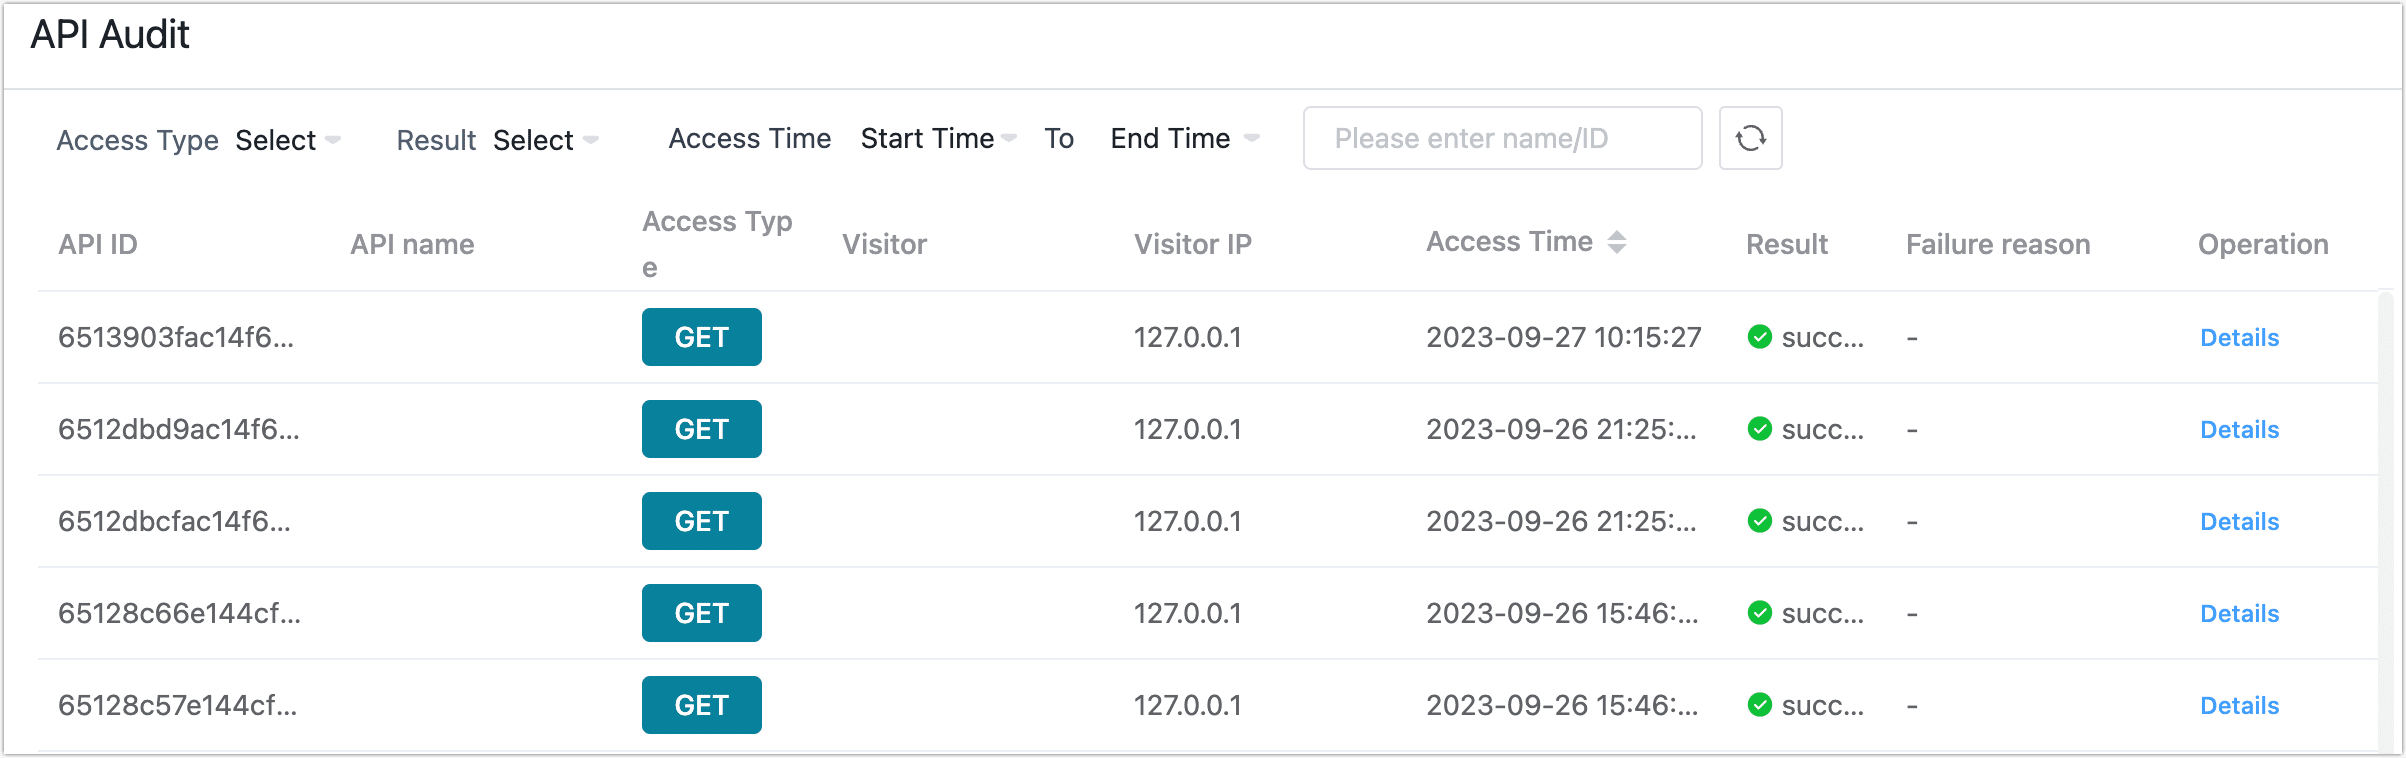
Service auditing is primarily used to view the access records of APIs. You can view the records of each request, including access type, personnel, IP address, access time, access result, failure reason, etc. You can also filter according to different conditions.
Log in to TapData Platform and select Data Services > Service Audit on the left side of the page to view.
Click Details to view detailed information about the corresponding request, as follows:
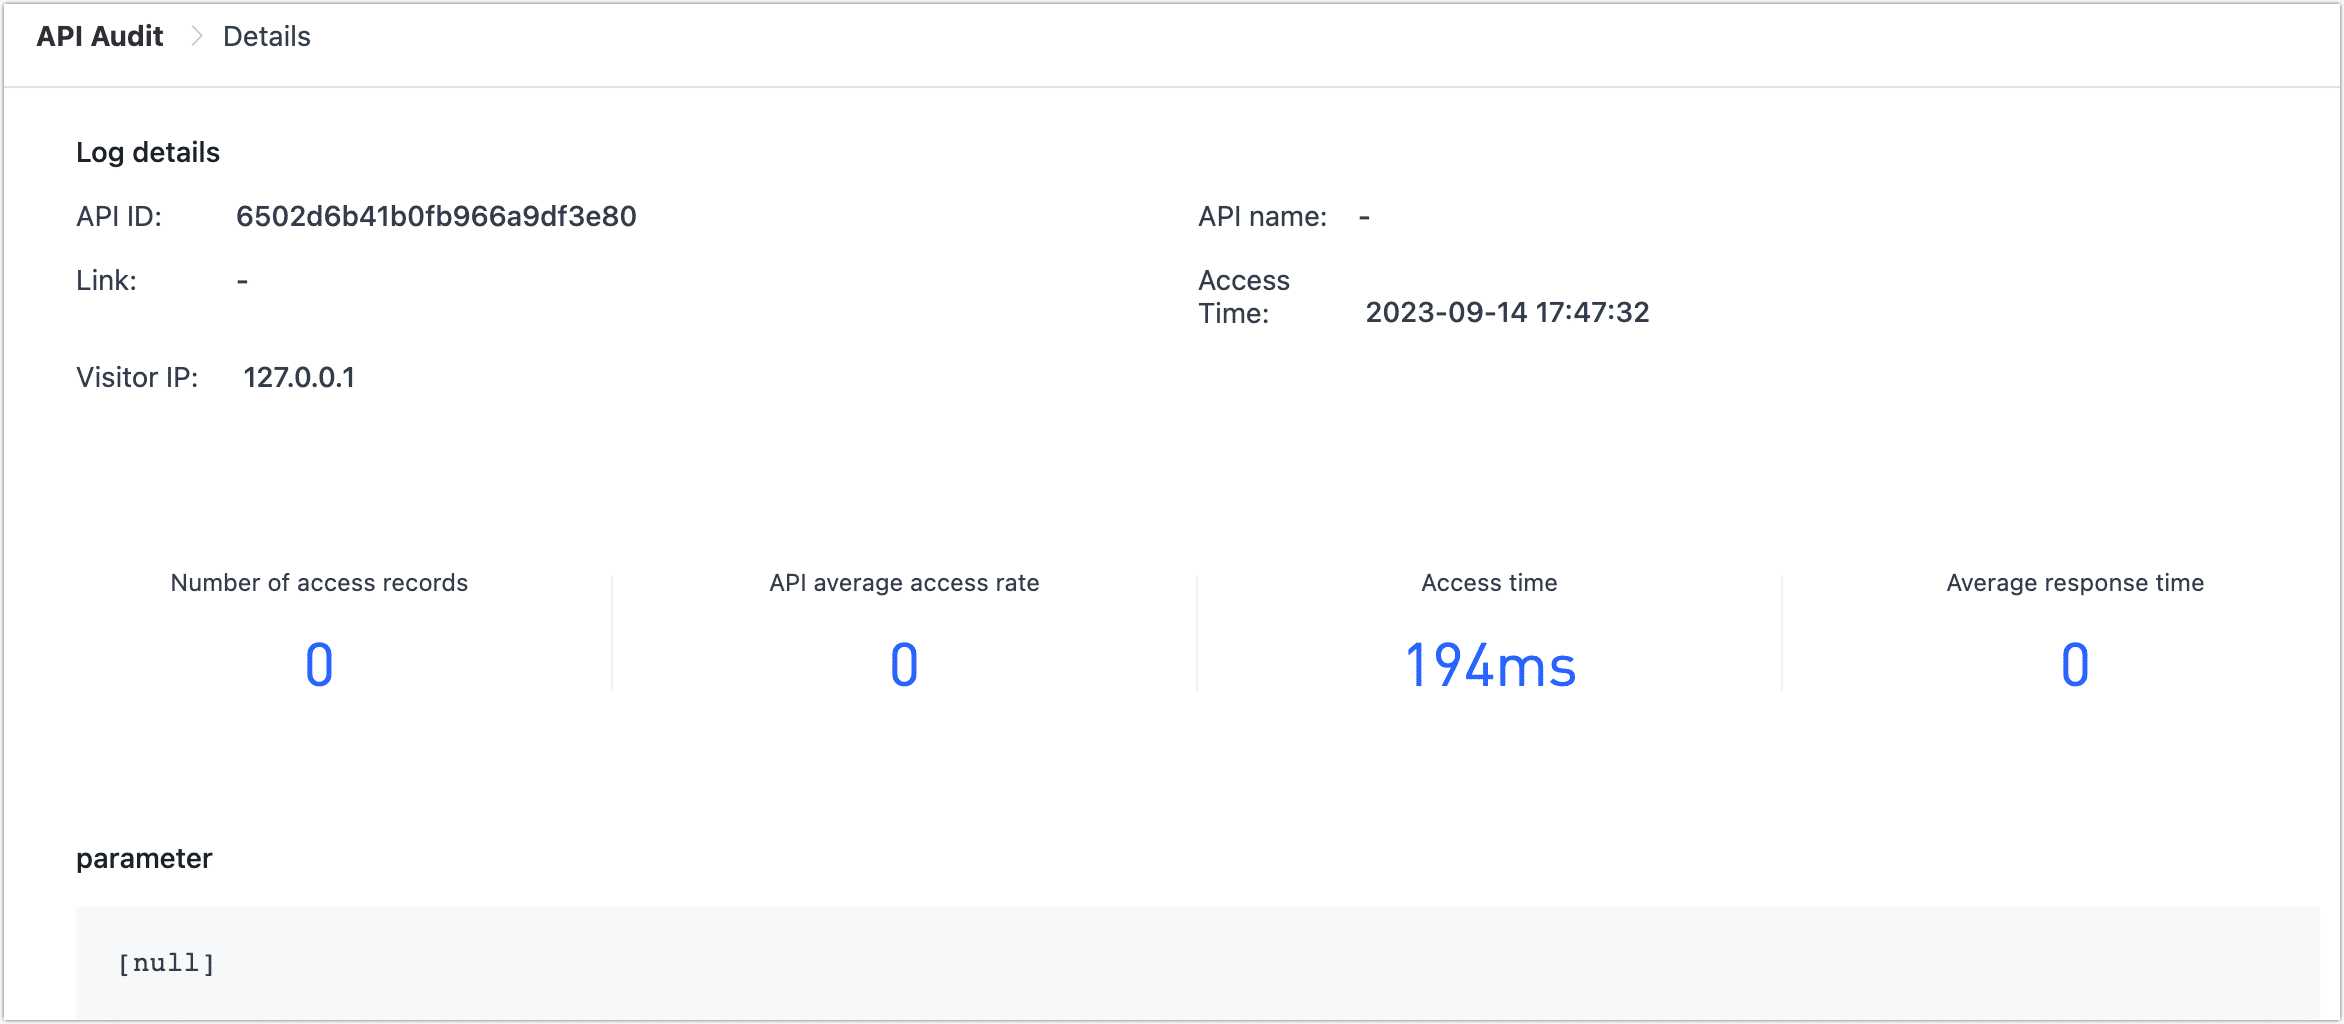
- Log Details: Includes basic information and various metrics of the access, such as API ID, name, IP address of the visitor, etc.
- Number of Access Records: The total number of records for this access (entries).
- API Average Access Rate: The average data transmission speed for a single access to the API.
- Access Time: Statistical computation of the time consumed for a single access to the API.
- Average Response Time: The average response time per record for a single access to the API.