DaaS Dashboard
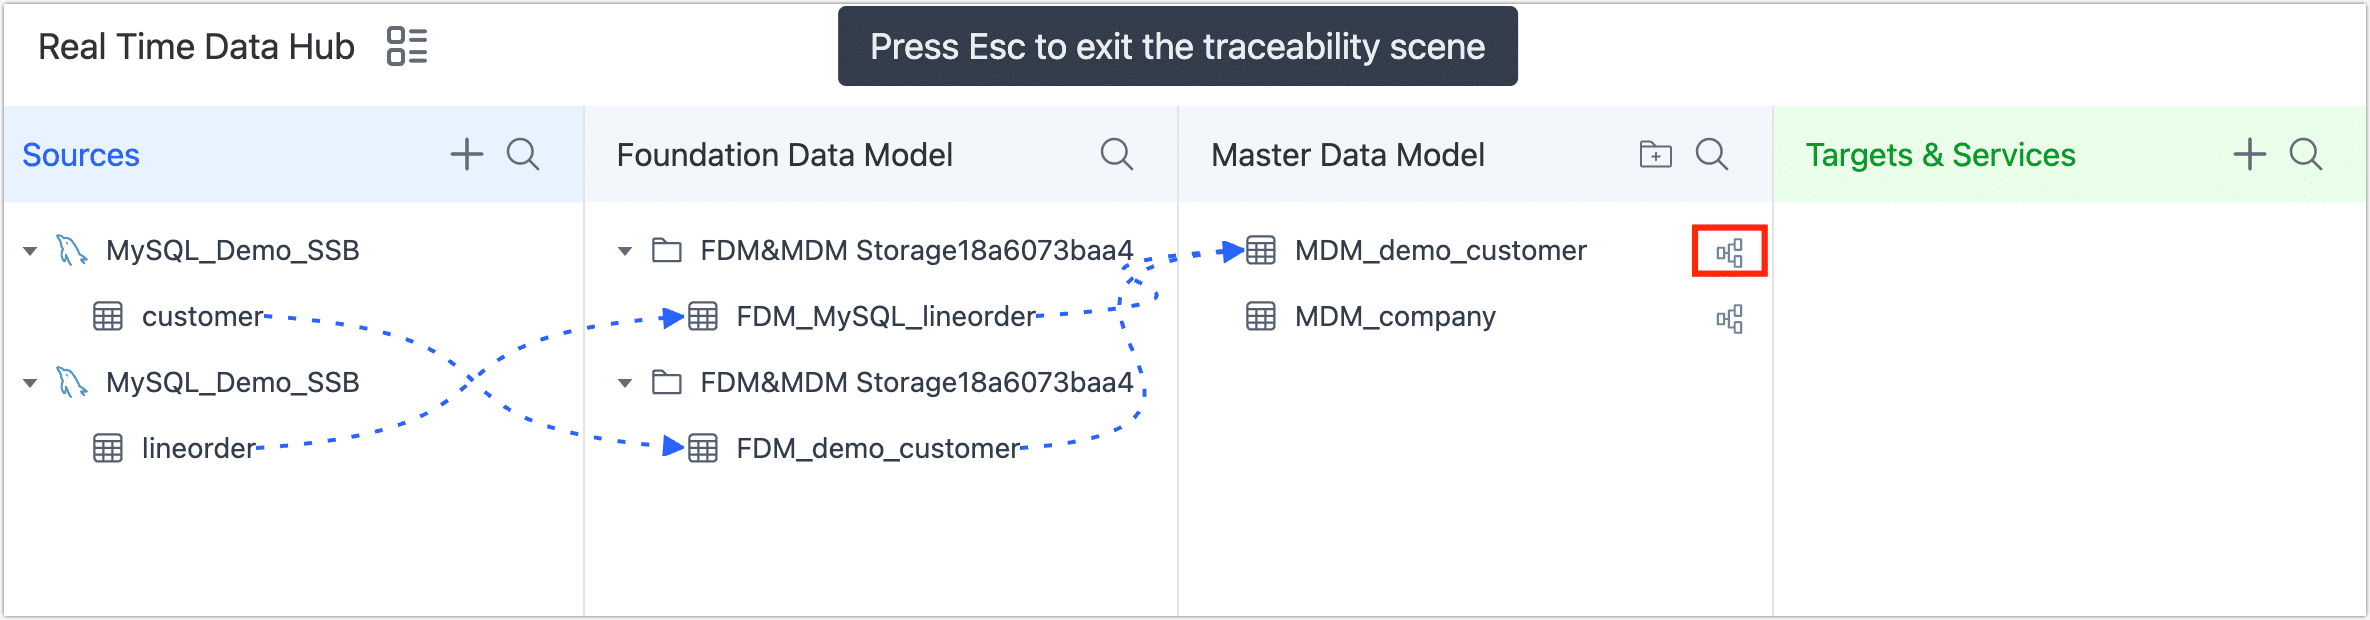
Once the data service platform mode is activated, the page will be organized according to the previously mentioned hierarchy. You can effortlessly drag the table to the next level, which will automatically create data replication tasks and streamline the data flow.
This article provides a comprehensive guide on utilizing the Data Service Platform Mode interface, enabling you to swiftly grasp the functionality of the various modules.
Procedure
In the left navigation panel, click Real-Time Data Hub.
On this page, you can conveniently view the information you have entered for your data source. In the following sections, we will explain the functions of each button available.

- ① Switch View Model
- ② Add Data Sources
- ③ Search Tables
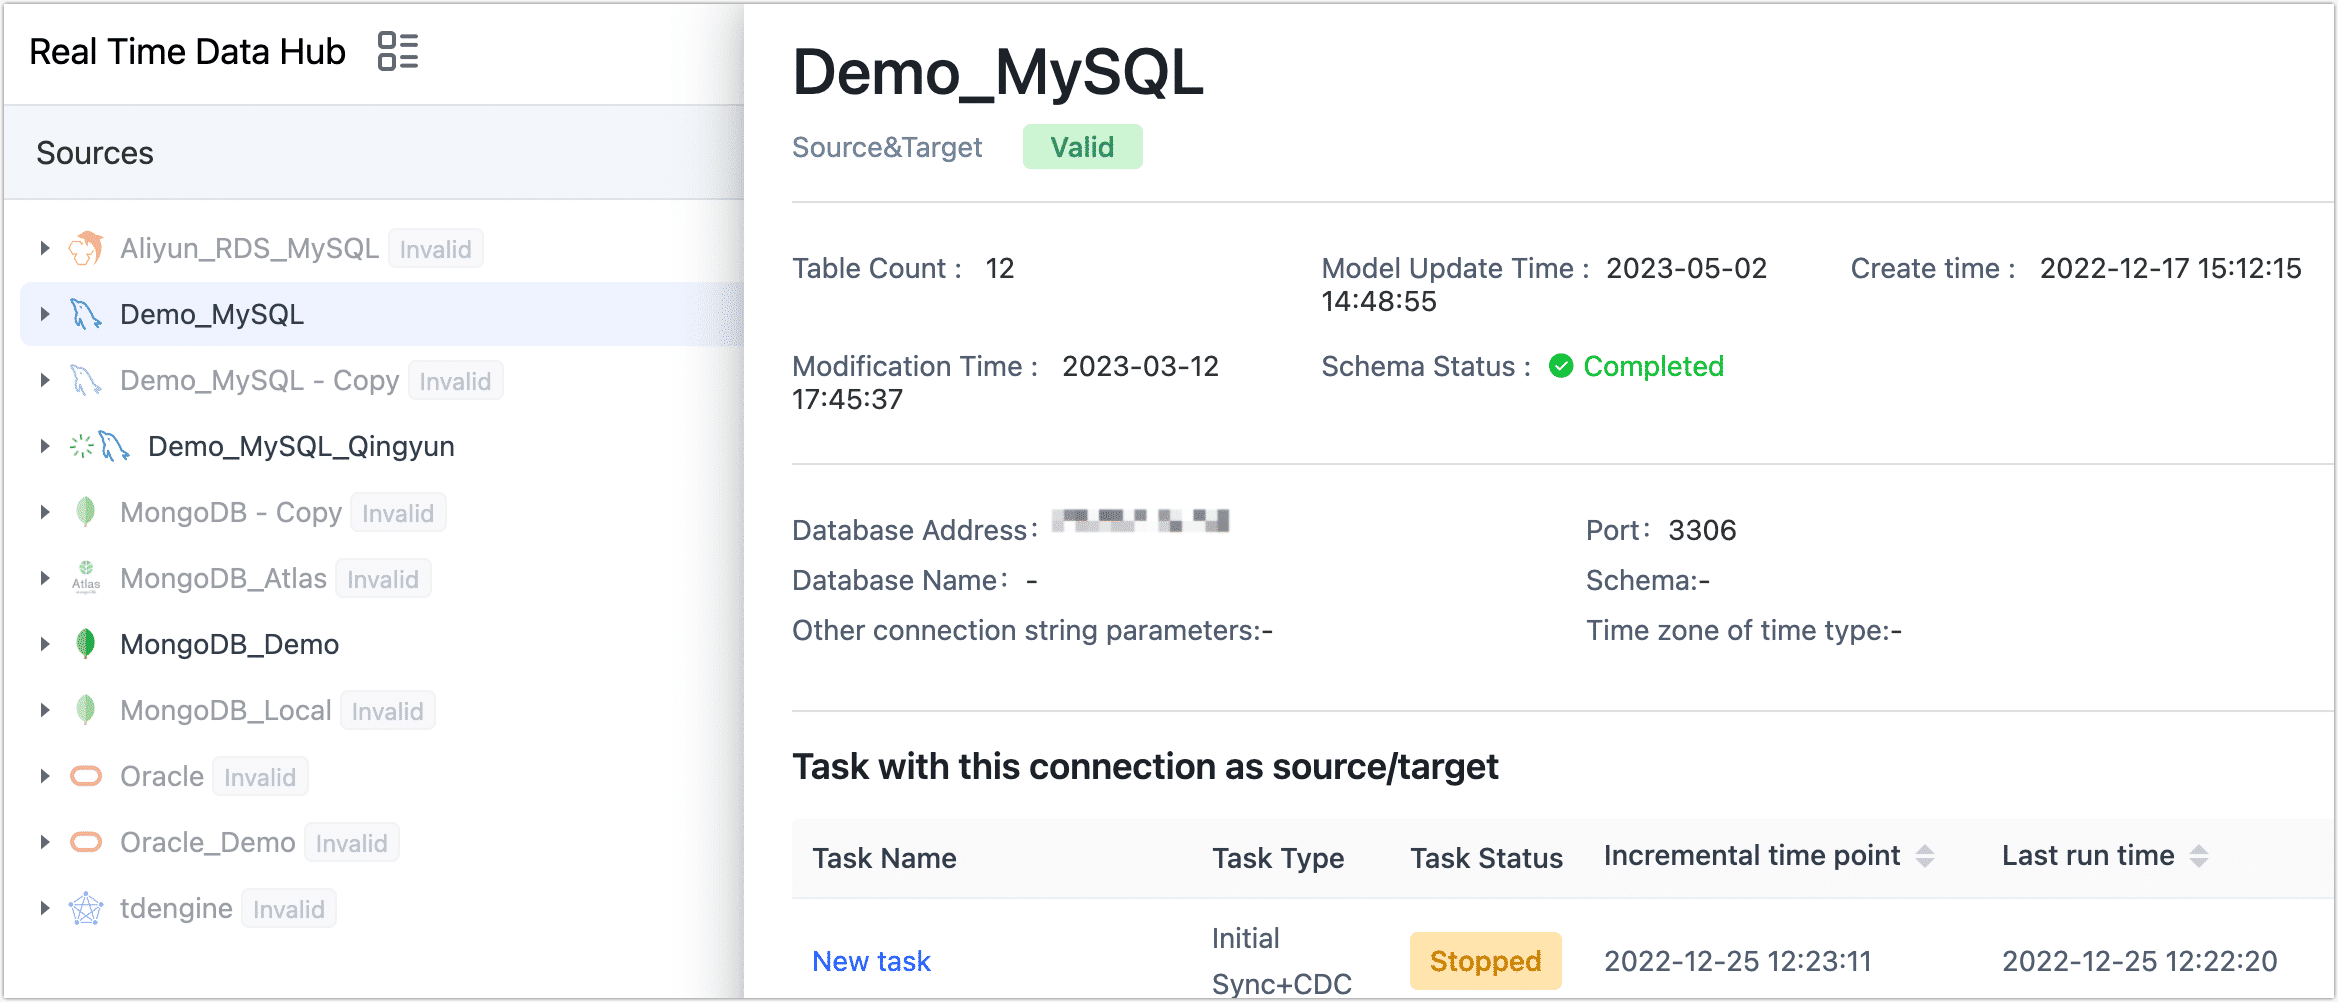
- ④ Data Source Detail
- ⑤ View Table Lineage
- ⑥ View Related Tasks
Click the ![]() icon allows you to view the data source information in the form of a directory structure. You can navigate through the directory structure to select a specific table.
icon allows you to view the data source information in the form of a directory structure. You can navigate through the directory structure to select a specific table.
In the catelog view, if you select a specific table, you can also see table details on the right-hand side of the page. The introduction to each tab is as follows:
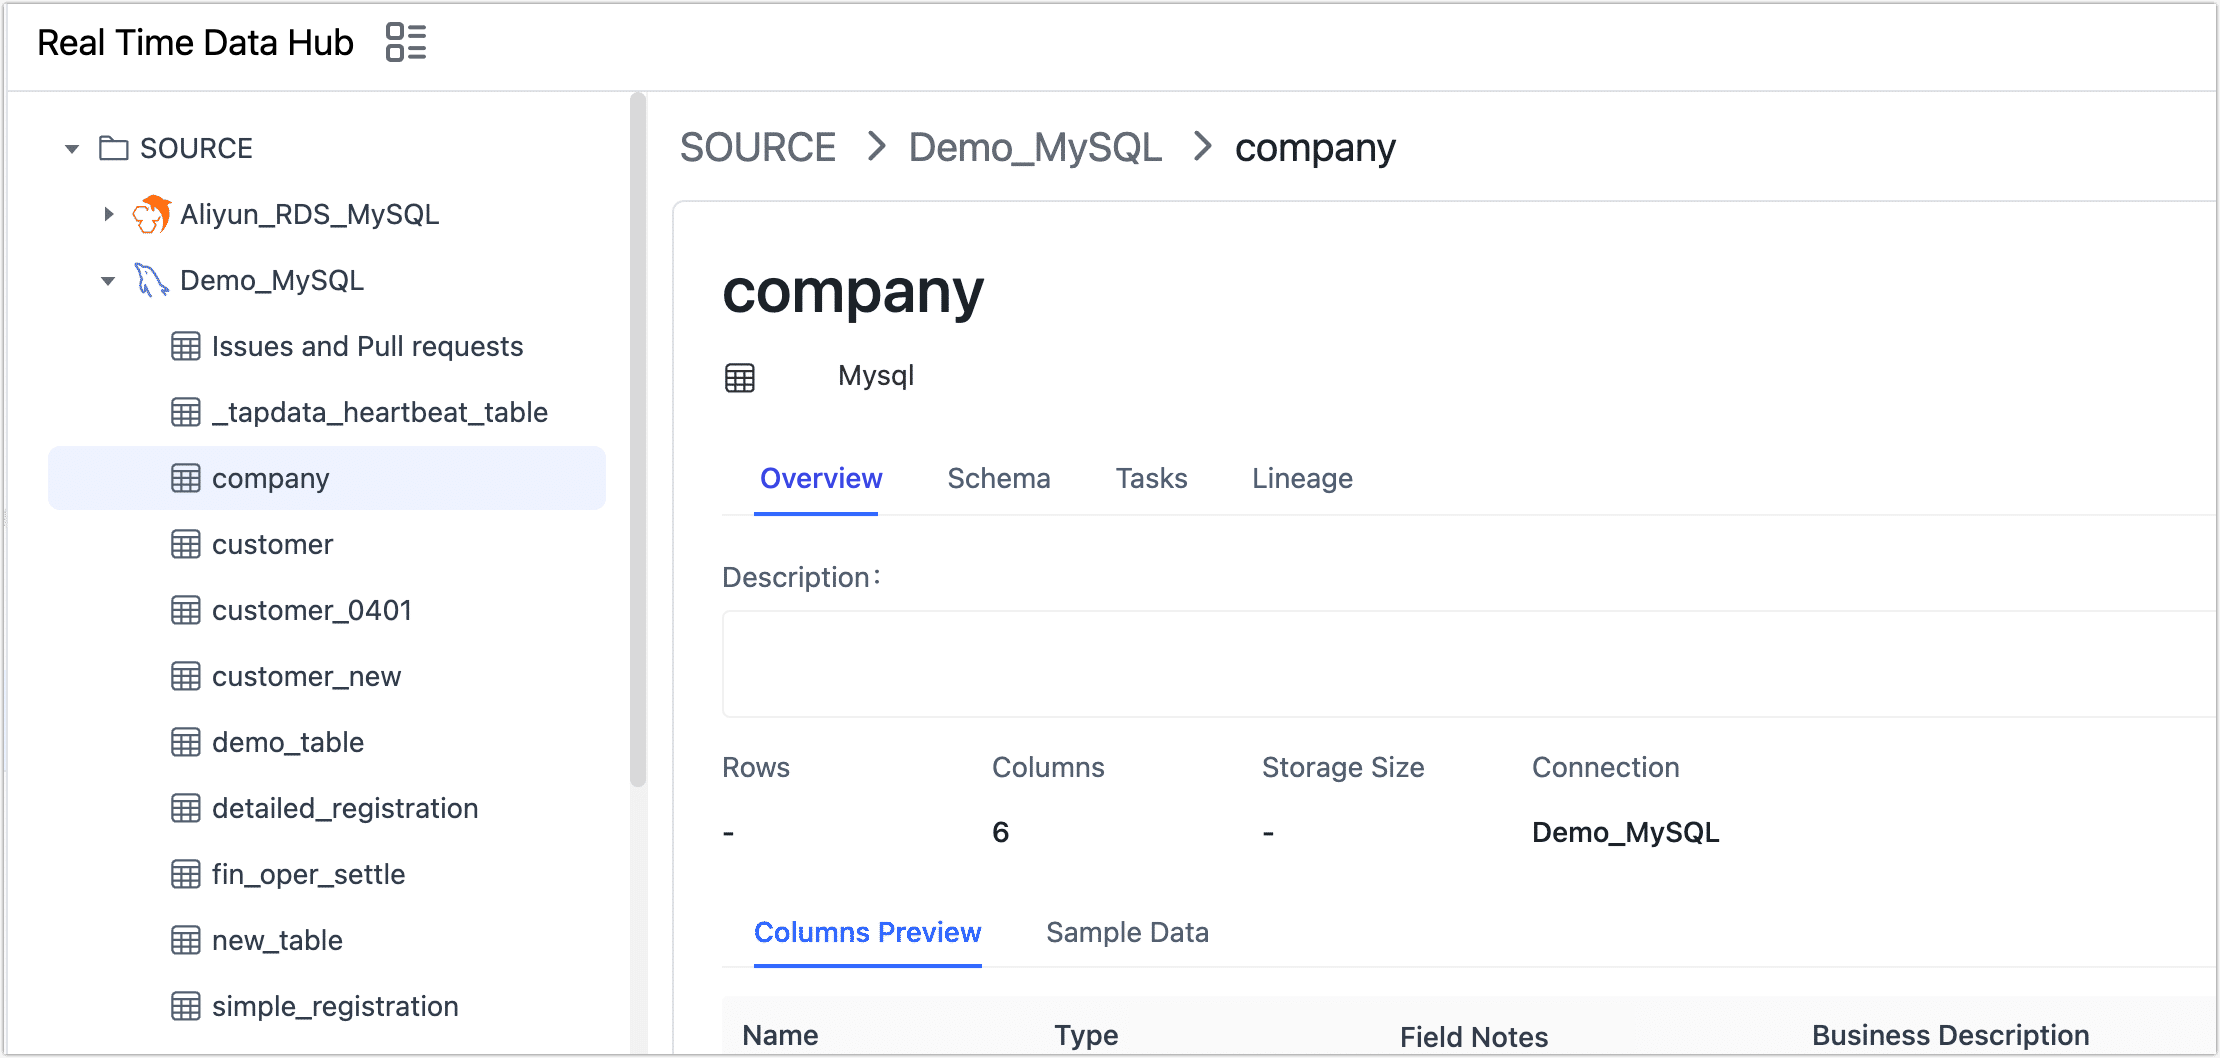
- Overview: Provides essential information about tables, including table size, row count, column types, column descriptions (sourced from comments by default), sample data, and more.
- Schema: Offers in-depth insights into table columns, encompassing details like column types, primary keys, foreign keys, default values, and more.
- Tasks: Displays associated tasks for the table, along with their respective statuses. This tab also enables the creation of new tasks.
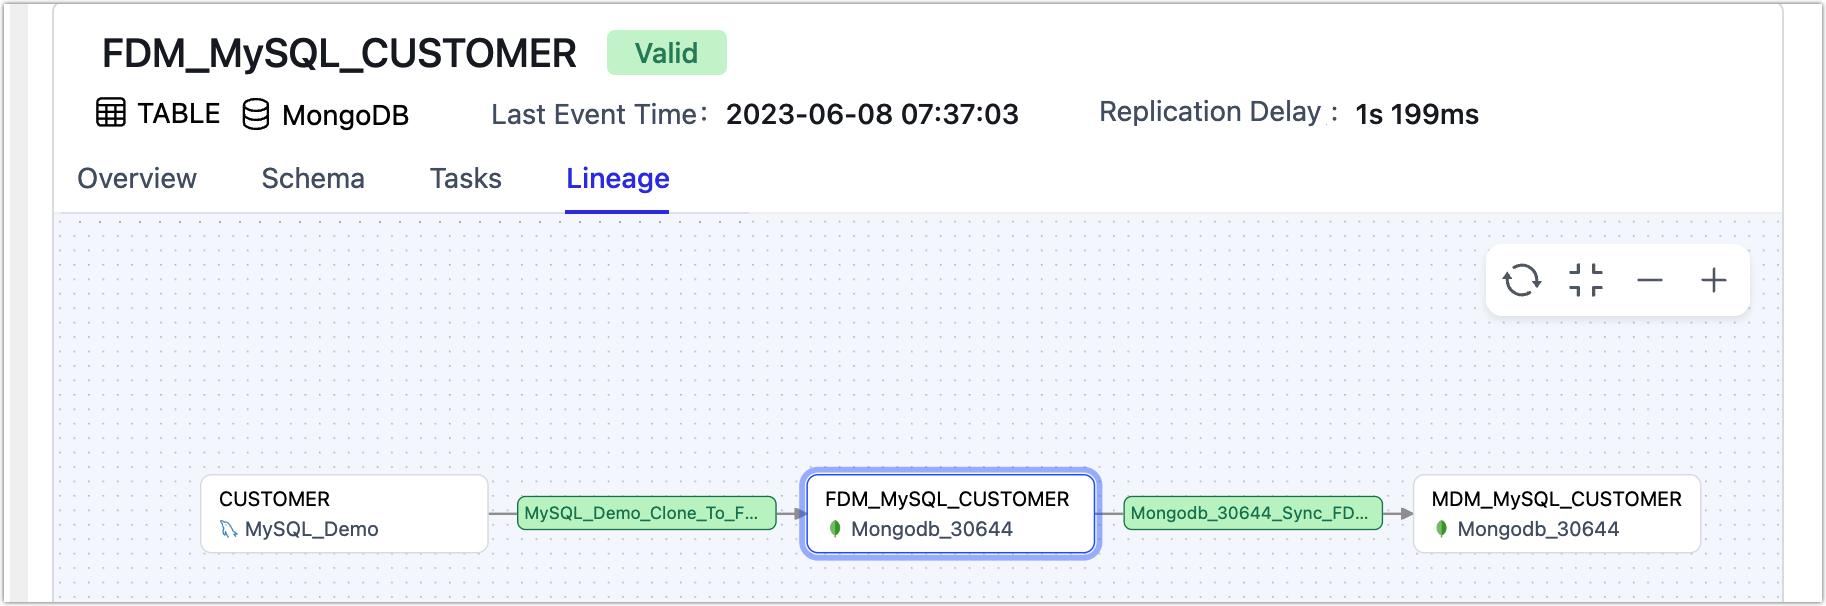
- Lineage: Presents data lineage relationships visually through a graph format, aiding in effective data quality management. Clicking on a task node allows direct navigation to the monitoring page of the relevant task.