Maintenance
This article lists common issues related to TapData maintenance.
How to Start or Stop Services?
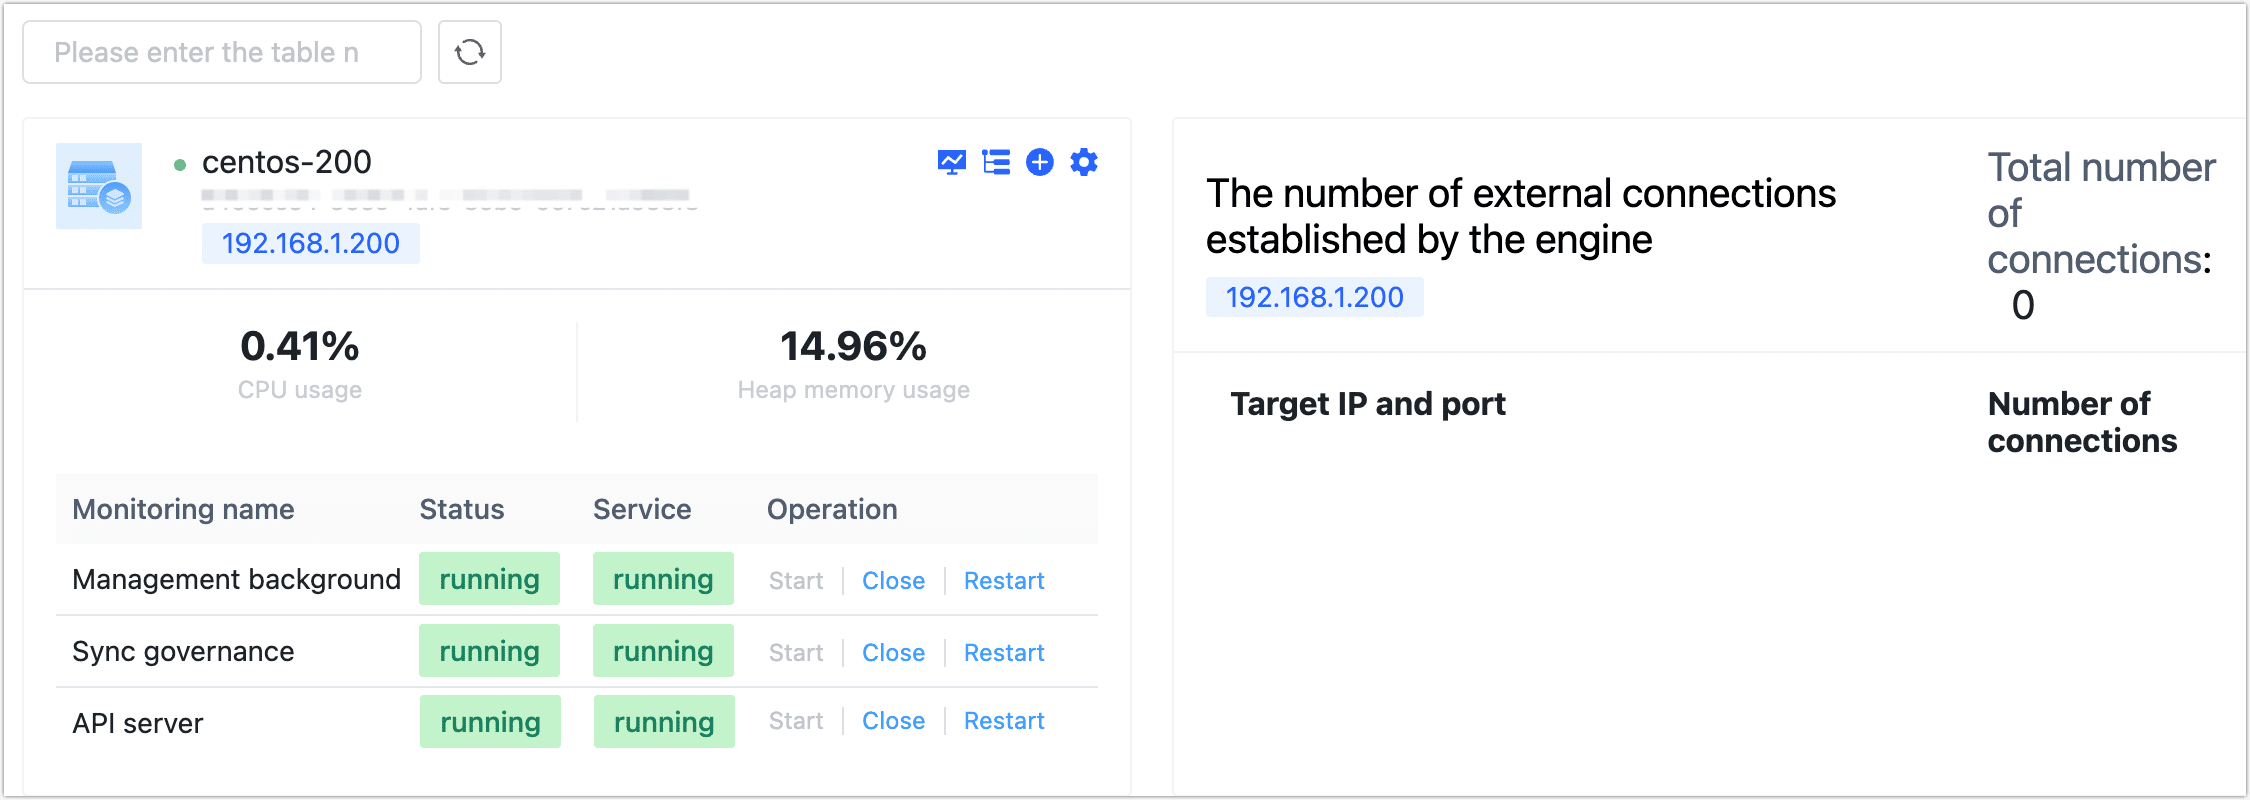
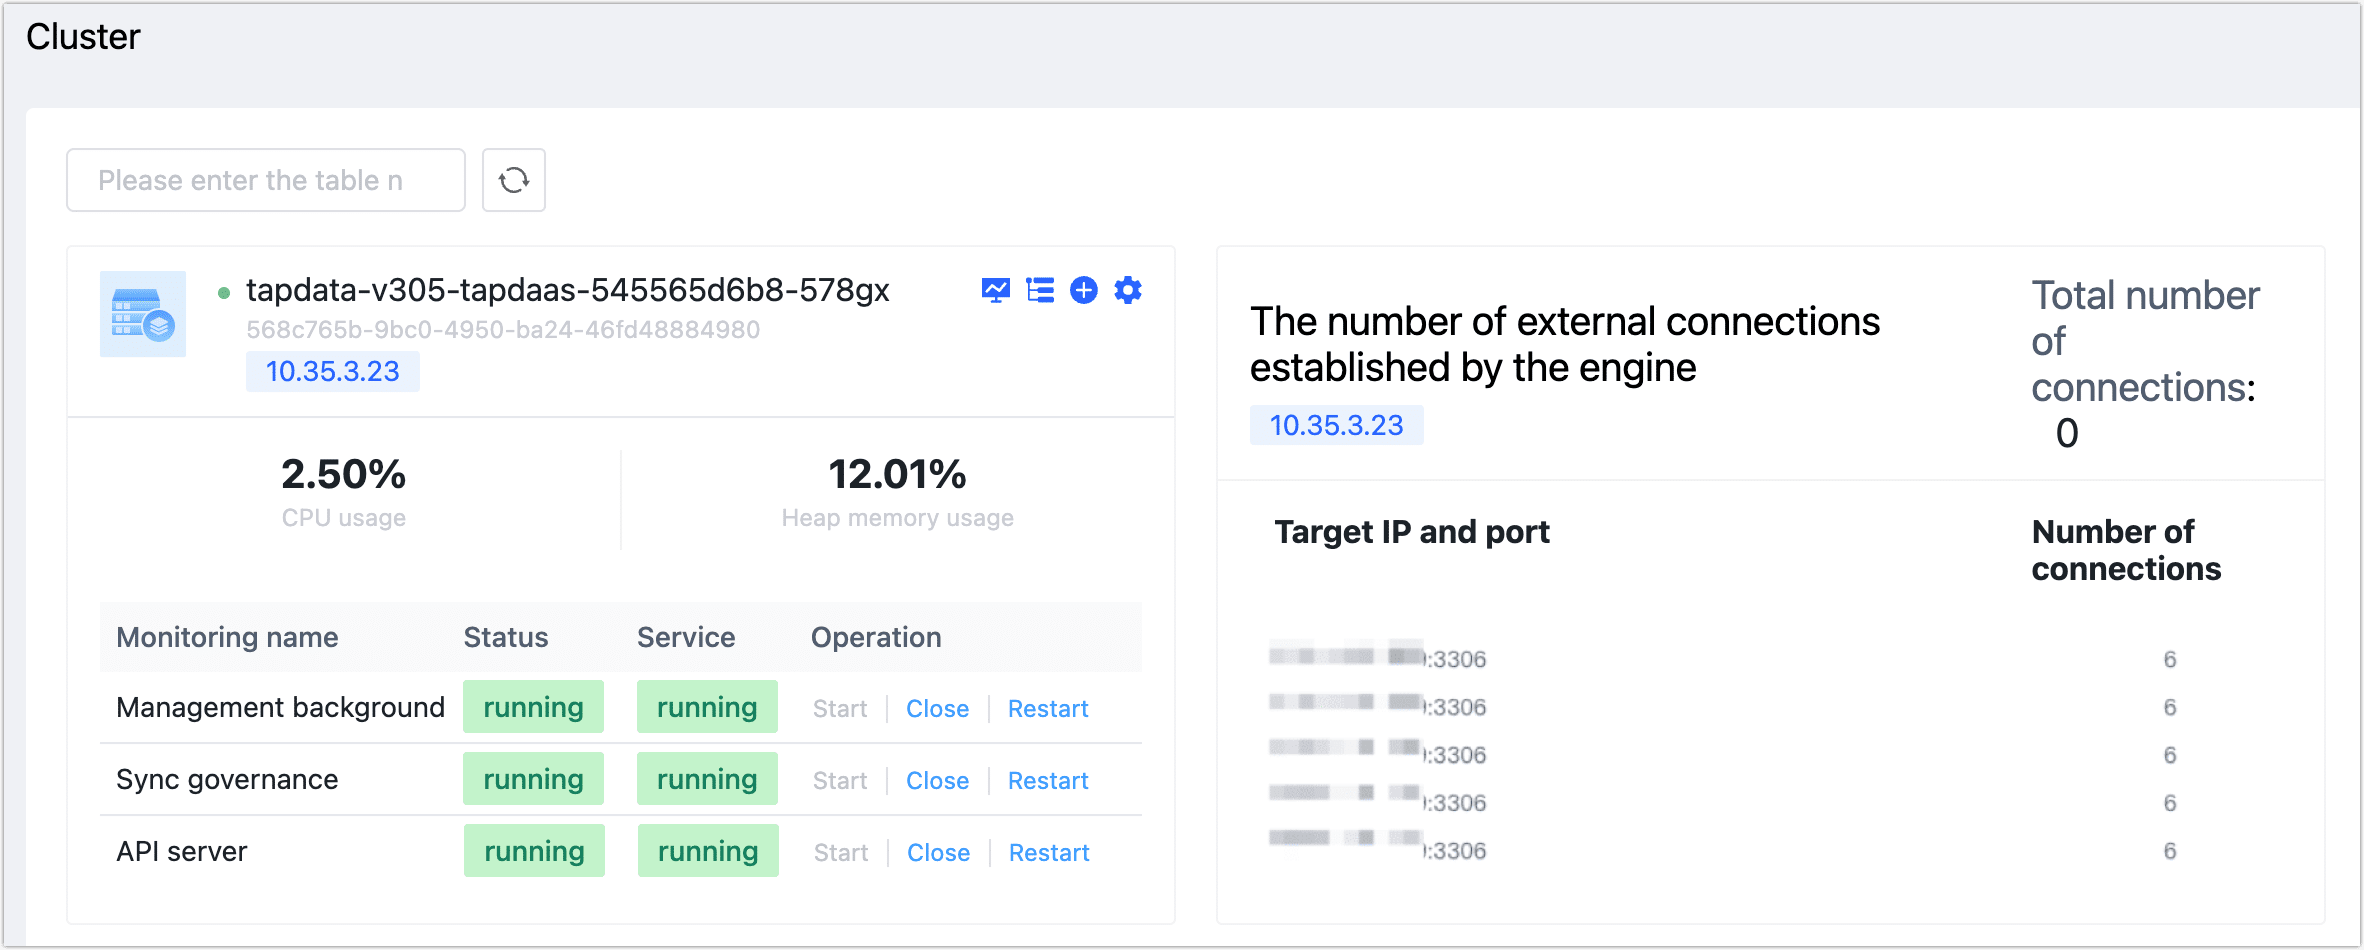
After logging into the TapData platform, you can start or stop the target service under System Management > Cluster Management.
Besides this method, you can also use the built-in tapdata command tool for starting or stopping operations. This tool is located in the TapData installation directory. You can view command help information by executing ./tapdata help. The output is as follows:
./tapdata help
 _______       _____  _____       _______
|__   __|/\   |  __ \|  __ \   /\|__   __|/\
   | |  /  \  | |__) | |  | | /  \  | |  /  \
   | | / /\ \ |  ___/| |  | |/ /\ \ | | / /\ \
   | |/ ____ \| |    | |__| / ____ \| |/ ____ \
   |_/_/    \_\_|    |_____/_/    \_\_/_/    \_\

WORK DIR:/root/tapdata
usage: tapdata [option] [subsystem]
Option:
  start            Start TapData
  stop             Stop TapData
  restart          Restart TapData
  status           Check the running status
  init             Initialize TapData Configuration
  resetpassword    Reset MongoDB password or certificate key file password
  --version        TapData version
  help             Show this usage information

Subsystem:
  frontend         TapData management portal
  backend          Data Processing Node
  apiserver        API Server Node
How to Perform a Rolling Upgrade?
Starting with version 3.3.0, TapData supports rolling upgrades. Compared to the standard downtime upgrade, it helps shorten the upgrade window and further reduce business impact. The specific steps are as follows:
Ensure compatibility between the two versions before and after the upgrade. It is recommended to perform the upgrade when tasks have entered the incremental phase or during off-peak hours.
Log into the server hosting TapData, keeping the original version of the TapData service running.
Download and unzip the 3.3.0 version installation package, then enter the package directory.
Execute the following command to complete the rolling upgrade process. Upon completion, you will be prompted:
Update finished. All Task are running.../tapdata upgrade --source <old_version_path>old_version_path: The directory where the old version of TapData is installed, for example:./tapdata upgrade --source /root/320/tapdata/tipIf you encounter errors during the upgrade, executing the upgrade command again will continue from where it left off. To reset the upgrade status, execute
./tapdata upgrade reset.After the upgrade, log into the TapData platform, click on the username in the upper right corner, and select system version to confirm the upgrade was successful.
In the TapData platform's left navigation bar, select System Management > Cluster Management and confirm all services are running normally.
How to Scale the TapData Cluster?
When facing performance bottlenecks, nearing resource limits, or needing to improve system fault tolerance and high availability, you can scale the cluster. The specific operation process is as follows:
Complete the environment initialization for the new machine.
Log into the server and execute the following commands to set file access numbers, firewall, and other system parameters.
ulimit -n 1024000
echo "* soft nofile 1024000" >> /etc/security/limits.conf
echo "* hard nofile 1024000" >> /etc/security/limits.conf
systemctl disable firewalld.service
systemctl stop firewalld.service
setenforce 0
sed -i "s/enforcing/disabled/g" /etc/selinux/config
Install Java version 1.8.
yum -y install java-1.8.0-openjdkSet the system time.
# Method 1: use ntpdate
# nptdate -u cn.ntp.org.cn
crontab -e
# Add at the last line
* */1 * * * ntpdate -u ntp1.aliyun.com

# Method 2: specify with date -s
date -s '10:34:06'

# Sync system time to hardware to prevent time reset after system reboot
hwclock -w
Download the TapData installation package (you can contact us to obtain it) and upload it to the device to be deployed.
On the device to be deployed, execute the following command to unzip the installation package and enter the unzipped path.
tar -zxvf installation_package_name && cd tapdataExample:
tar -zxvf tapdata-release-v2.14.tar.gz && cd tapdataComplete the scaling operation on the device to be deployed.
Copy the application.yml file from the existing node's TapData working directory to the working directory of the device to be deployed, then comment out or delete the line containing uuid in that file.
Upload the License file to the TapData working directory.
Start and scale the required services.
# Scale TapData management service
./tapdata start frontend

# Scale TapData API service
./tapdata start apiserver

# Scale TapData engine service
./tapdata start backend
After successful startup, you can log into the TapData platform and check the status of various services under System Management > Cluster Management.
How to Ensure High Availability for MongoDB Dependent by TapData?
Avoid using a single-node architecture. Use a replica set deployment architecture to ensure high availability. For instance, in a three-node replica set architecture, one node acts as the Primary node, and the other nodes act as Secondary nodes.
If you are currently using a single-node architecture, you can convert it to a replica set architecture.
In a replica set, data written to the Primary node are automatically synchronized to the Secondary nodes. If the Primary node fails or becomes unavailable, the replica set automatically elects a new Primary node to ensure database availability and data integrity, minimizing the downtime and impact of database failures.
You can log into the MongoDB database and use the rs.status() command to check the status of the replica set and the state of each node. For more information, see Replication.
How to View Running Logs?
In versions prior to 2.15, logs were scattered across various folders in the TapData installation directory. Starting from version 2.15, log information is centralized in the logs directory within the installation directory.
Where Are TapData Configuration Files Stored?
The TapData configuration file: application.yml is located in the TapData installation directory. It contains key configuration information, such as available memory settings, service ports, MongoDB database connection information, etc.
How to Adjust the Available Memory Size for Java?
By default, the available memory is set to 4 GB. To adjust it, go to the application.yml file in the TapData installation directory, edit the file, and adjust the memory configuration information according to the server's available memory and task load. For example, configuring it as tapdataJavaOpts: "-Xms8G -Xmx16G" means the initial memory is 8G, and the maximum memory is 16G, as shown below:
tapdata:
    cloud:
        accessCode: ""
        retryTime: '3'
        baseURLs: ""
    mode: cluster
    conf:
        tapdataPort: '3030'
        backendUrl: 'http://127.0.0.1:3030/api/'
        apiServerPort: '3080'
        apiServerErrorCode: 'true'
        tapdataJavaOpts: ""
        SCRIPT_DIR: etc
        reportInterval: 20000
        uuid: 093288a0-9ab9-4752-bd1c-7163aea4a7ba
        Decimal128ToNumber: 'false'
        tapdataTMJavaOpts: '-Xmx8G -Xms16G'
If the memory allocation is small but the task load is heavy, the Java program may continuously perform garbage collection due to insufficient available memory, causing a spike in CPU usage.
Management Subprocess Keeps Restarting, How to Troubleshoot?
- Check whether the MongoDB engine used as TapData's storage can be normally connected and that its version is 4.0 or above.
- Execute
./tapdata restart frontend, then find the frontendDebug.log file in the logs directory and review it. Analyze the specific reason for the problem through the error messages in the log.
What Are the Rules for Task Scheduling?
- When a task starts: Query the number of tasks each alive engine is running and schedule the task to the engine with the smallest number of running tasks.
- Heartbeat timeout: The engine will send heartbeat messages to the tasks it takes over. After a heartbeat timeout, the task is rescheduled to the alive engine with the smallest number of running tasks.
- Takeover timeout: After being scheduled to an alive engine, if the task is not taken over by the engine within the timeout period, the task is rescheduled to the alive engine with the smallest number of running tasks.
How Does TapData Achieve High Availability?
You can deploy TapData on multiple machines to achieve high availability. If one node experiences an anomaly, other nodes can continue to provide services. Tasks that have entered the incremental phase will resume from the breakpoint, and tasks can be automatically balanced and distributed.
A Task Encounters an Exception, How to Troubleshoot?
Although the reasons for task exceptions may vary, you can refer to the following general troubleshooting process:
Log into the TapData platform, find the target task, and review the specific error message. Make adjustments based on the error message (e.g., table does not exist).
Log into the machine hosting TapData, go to the TapData installation directory, and review more log information.
If you cannot log into the TapData platform, execute
./tapdata statuson its hosting machine to check if the services are running normally../tapdata status
_______ _____ _____ _______
|__ __|/\ | __ \| __ \ /\|__ __|/\
| | / \ | |__) | | | | / \ | | / \
| | / /\ \ | ___/| | | |/ /\ \ | | / /\ \
| |/ ____ \| | | |__| / ____ \| |/ ____ \
|_/_/ \_\_| |_____/_/ \_\_/_/ \_\
WORK DIR:/root/tapdata
Tapdata was stopped.
Tapdata Engine PID:
Tapdata Management PID:
API Server Controller PID:
API Server Instances PID:As shown in the example above, if the services are stopped, you can execute
./tapdata startto start the relevant services.
Synchronization Performance is Poor, How to Troubleshoot?
For synchronization performance issues, we need to decompose the execution process of the task into source, destination, and engine, and then identify the potential bottleneck node.
- Destination: Replace logic. For example, replace the destination with DummyDB to observe the task execution. If there is a significant performance improvement, it can be preliminarily determined that the problem lies with the destination side. Start the detailed investigation from there.
- Engine: Trace logic. Sort each processing node of the engine by processing time delay to find the information of the top N longest delay nodes for detailed investigation. Then, create a clone of the problem task and trace each entity data from source to destination, recording the delay of the data passing through the engine processing nodes. Output the most detailed log information to identify the specific problem cause of the problem node.
- Source: Exclusion logic. Since TapData's implementation for different sources varies, the method to determine whether a problem is related to the source is to first ensure the problem is not related to the destination and engine. Then, based on the specific situation of the source, determine the investigation strategy.
Additionally, we also need to consider the processing delays and network transmission delays in different stages.
The MongoDB Database Dependent by TapData Experiences an Exception, How to Troubleshoot?
MongoDB database exceptions can have various causes. The general troubleshooting process is as follows:
Check hardware resources, such as CPU, memory, and disk space. If resources are insufficient or disk space is exhausted, it might cause database exceptions.
Review MongoDB log files, especially the logs of the last few startups. Log files typically record warnings, errors, exceptions, etc., which can help identify the source of the problem.
You can also log into the database through the mongo shell to view more information. For more information, see getLog.
Log into the MongoDB database and execute the
db.serverStatus()command to view the current database status and statistics, analyzing if there are performance issues. For more information, see serverStatus.Try using MongoDB's built-in tools for troubleshooting, such as
mongotopto view the read and write operations of each collection, andmongostatto view the server's activity status.
What Is the Database Name in the MongoDB Database Dependent by TapData, and What Are the Collections?
The adopted database name is tapdata. You can log into the database through the mongo shell to see the specific collections included, as shown below:
# Enter the tapdata database
use tapdata;

# Show the collections in the current database
show collections;

# View the data in a specific collection
db.ClusterState.find();
Focus on the following collections, which may change with version updates:
- ClusterState: Cluster state information
- ClusterStateLog: Cluster state logs
- Connections: Connection source property information
- DatabaseTypes: Supported data source types (dictionary data)
- DataCatalog: Data catalog information
- DataFlows: Task property status information
- DataFlowStage: Task property stage information
- DeleteCaches: Cached delete data
- Events: Notification events of task execution
- Jobs: Task execution process information
- LineageGraph: Data map
- Logs: Log information
- Message: Messages
- MessageQueue: Message queue
- MetadataDefinition: Metadata definitions
- MetadataInstances: Metadata information
- Modules: Data publishing - API publication information
- nodeConfig: Custom node configuration information
- Permission: Permission information (dictionary data)
- Role: Roles
- RoleMapping: Roles and their permissions
- ScheduleTasks: Task scheduling information
- Settings: System settings information
- User: User information
- UserLogs: User operation information
- Workers: Process information
- License: License information
- TypeMappings: Type mappings
What Are High-Risk Operations?
By closely reviewing system high-risk operations, timely identification and response to potential threats can ensure data security, integrity, and availability in system operations. Understanding various high-risk operations helps establish reliable platform management systems, permission management systems, and improves the recognition of various security challenges, thus laying the foundation for the company's data processing procedures and platform management standards.
Common high-risk operations include:
- Connection Management
- Deleting data source connections: To avoid accidental deletion, when performing a deletion operation, a prompt will appear if the connection is referenced by a task.
- Editing data source connections: If the parameters of the data source are set incorrectly, it may cause the connection to fail. Tasks referencing this data source will use the previous parameters and will not be affected, but new tasks or tasks reset afterwards may trigger errors.
- Data Replication/Data Transformation Tasks
- Resetting tasks: This operation will reset the task to its initial state, clearing historical monitoring data. Subsequent task starts will require re-executing full data synchronization.
- Data duplication processing strategy: In the target node settings, setting different data duplication strategies will affect the structure and data of the target table. For example, selecting Clear existing target table structure and data will clear the target table's structure and all data upon task start, synchronizing new table structures and data from the source.
- Setting data write strategy: In the advanced settings of the target node, if append write is selected, TapData will only process insert events, discarding update and delete events. Choose carefully based on business needs to avoid the risk of data inconsistency.
- Setting synchronization index: When
a data replication task is used for scenarios that only synchronize incremental data, i.e., retaining target table data, if the target table's data scale is large, the synchronization index operation may affect the overall performance of the target database.
- Setting update condition fields: If there is no index on the target, an index will be created based on the update condition fields.
- Task Agent settings: In the task settings in the upper right corner, if an Agent is manually specified, this configuration item will remain unchanged when the task is copied, which may cause excessive pressure on a single Agent. It is recommended to set it to Automatically assigned by the platform.
- Data Services
- Deleting or taking an API offline will render it unavailable.
- System Management
- When managing a cluster, only perform close or restart operations on related services when they are experiencing anomalies.