Deploy Prometheus monitoring
TapData provides component and runtime metrics through HTTP endpoints. Prometheus collects these metrics, Grafana displays trends, and Alertmanager sends notifications. Task metrics are deployment-dependent and must be verified in the target environment.
This page covers the complete path from enabling metric endpoints to validating collection. After deployment, continue with:
- Metric reference and health assessment to understand values, trends, and initial thresholds.
- Use the Grafana dashboards to import templates and interpret panels.
- Configure alerts and routine monitoring checks to load rules, configure notifications, and establish an incident process.
Before you begin
Prepare a monitoring server that can reach every required TapData metric endpoint. Confirm the following requirements:
- Docker and Docker Compose are installed, and the disk can store Prometheus data for the planned retention period.
- The monitoring server can reach metric ports on every TapData node. Network controls allow access only from the monitoring network or approved sources.
- You can restart TapData during a maintenance window to apply monitoring settings.
- You have selected a Grafana administrator password, alert recipients, notification channels, and at least one test task.
- If Prometheus, Grafana, or Alertmanager already exists in your organization, integrate with that platform instead of deploying duplicate services.
After completing this page, required targets should be UP in Prometheus, Grafana should connect to Prometheus, and the TapData rules should be loaded. To deliver notifications, you must also configure an alert receiver.
Use an existing monitoring stack
If your organization already runs one or more of Prometheus, Grafana, and Alertmanager, reuse those services and deploy only the missing components. You do not need a separate monitoring stack for TapData. The steps below assume that Prometheus is available. If it is not, deploy Prometheus from Step 2 before you continue:
- Complete Step 1 and verify that the monitoring server can reach each enabled TapData metric endpoint.
- Follow Configure Prometheus to add verified endpoints to the existing
scrape_configs. Apply a consistentprojectlabel to targets in the same environment. - Download the TapData Prometheus alert rules. Then install and validate the applicable rule groups.
- Follow Download the templates and Import and configure a dashboard to add the required dashboards to Grafana.
- Complete Step 3 to verify collection, dashboards, rules, and notifications.
Monitoring scope
| Object | Purpose | Common metric endpoint (verify before use) |
|---|---|---|
| Management | Availability, HTTP requests, JVM, and host resources | http://<host>:3030/actuator/prometheus |
| Flow Engine | Task status, lag, and node processing time when available, plus JVM and host resources | http://<host>:3035/actuator/prometheus |
| Agent | Agent availability and host resources | http://<host>:3036/metrics |
| API Server | API requests, Node.js runtime, and process resources | http://<host>:3080/metrics |
| MongoDB | Replica set, Oplog, connections, and database resources | Provided by mongodb_exporter, normally at http://<host>:9216/metrics |
Available components and endpoints vary by deployment. Complete Verify the endpoints first. Create a scrape job only when the endpoint returns HTTP 200 with Prometheus metrics. An open port does not guarantee that the endpoint returns metrics.
Metric endpoints normally do not require application authentication. In production, restrict access with a firewall, security group, authenticated reverse proxy, or dedicated monitoring network.
Understand the task-metric limitation
Available metrics vary by deployment, component, and enabled feature. Use the endpoint output as the source of truth. Prometheus can successfully collect Flow Engine component metrics without receiving task state, connection, or lag metrics. Some environments provide only JVM, process, and host metrics.
Verify component collection and task metric availability separately. If the endpoint does not return task_status, task_active_db, task_cdc_delay_ms, and related metrics, the task dashboard shows No data and the tapdata-tasks rules cannot detect task failures. Component availability and resource monitoring still work. Continue to view task status, replication progress, and data validation on the TapData task monitoring page.
The CPU, disk, 5xx ratio, and duration values in this guide are initial recommendations, not fixed TapData limits. Set task lag thresholds from the business SLA. Adjust resource thresholds after collecting at least one week of peak and off-peak data.
Step 1: Enable and verify metric endpoints
Enable TapData monitoring
TapData monitoring is disabled by default. Enable it in the configuration file or with environment variables.
- Configuration file
- Environment variables
On every TapData server, edit application.yml:
tapdata:
  metrics:
    enable: true
    enginePort: 3035
    agentPort: 3036
On every TapData server, set the following variables and restart TapData according to the deployment method:
export TAPDATA_MONITOR_ENABLE=true
export TAPDATA_FE_MONITOR_PORT=3035
export TAPDATA_AGENT_MONITOR_PORT=3036
Verify the endpoints
Run the following function on the server where Prometheus will run. It checks both the HTTP response and the Prometheus metric format, so a JSON error or login page is not mistaken for metrics.
check_metrics() {
  url="$1"
  body=$(mktemp)
  if curl -fsS "$url" -o "$body" && grep -qE '^# (HELP|TYPE) ' "$body"; then
    echo "OK: $url"
    grep -m 3 -E '^# (HELP|TYPE) ' "$body"
  else
    echo "INVALID: $url did not return Prometheus metrics" >&2
    head -c 300 "$body" >&2
    echo >&2
  fi
  rm -f "$body"
}

check_metrics http://<tapdata-host>:3030/actuator/prometheus
check_metrics http://<tapdata-host>:3035/actuator/prometheus
check_metrics http://<tapdata-host>:3036/metrics
check_metrics http://<tapdata-host>:3080/metrics
Add only endpoints that report OK to Prometheus. For INVALID, connection refused, timeout, or 404 results:
- Confirm that the component is deployed on the node, monitoring is enabled, and the required restart is complete.
- Check the listening port, firewall, and container port mapping.
- Do not add the target to
prometheus.ymlyet. Confirm the metric endpoint supported by the deployed package.
Health checks and metric collection are separate checks:
| Component | Health endpoint | Successful result |
|---|---|---|
| Management | http://<host>:3030/health | HTTP 200 with response code equal to ok |
| Flow Engine | http://<host>:3035/actuator/health | HTTP 200 with response status equal to UP |
| Agent | http://<host>:3036/health | HTTP 200 with response status equal to ok |
| API Server | http://<host>:3080/status | HTTP 200 with response status equal to UP |
Decide whether to monitor the MongoDB system database
TapData uses MongoDB for configuration and task metadata. TapData metric endpoints do not automatically include MongoDB metrics. To monitor the MongoDB connection, replica set, and resources in the same platform, configure MongoDB monitoring. If a database team or cloud service already monitors the system database, skip this configuration to avoid duplicate exporters and alerts.
Step 2: Deploy Prometheus, Grafana, and Alertmanager
The following example deploys all three services on one monitoring server and binds their web ports to that server's private IP address. Operators on a network that can reach this private address can open the pages directly.
Prepare the directory and credentials
mkdir -p tapdata-monitoring
cd tapdata-monitoring
Create .env with the monitoring server's private IP and a Grafana administrator password:
MONITOR_BIND_IP=<monitor-host-private-ip>
GRAFANA_ADMIN_PASSWORD=<strong-password>
chmod 600 .env
Download the TapData Prometheus alert rules and save the file as tapdata-alert-rules.yml. Also create prometheus.yml, alertmanager.yml, and docker-compose.yml. To select rule groups based on available metrics, see Install and validate the rules.
Configure Prometheus
The project label identifies the environment for alert grouping and Grafana variables. Replace tapdata-prod and every target address with actual values. Remove scrape jobs that did not pass endpoint validation.
global:
  scrape_interval: 15s
  evaluation_interval: 15s

rule_files:
  - /etc/prometheus/tapdata-alert-rules.yml

alerting:
  alertmanagers:
    - static_configs:
        - targets: ['alertmanager:9093']

scrape_configs:
  - job_name: tapdata-management
    metrics_path: /actuator/prometheus
    static_configs:
      - targets: ['192.168.1.200:3030']
    relabel_configs:
      - target_label: project
        replacement: tapdata-prod

  - job_name: tapdata-flow-engine
    metrics_path: /actuator/prometheus
    static_configs:
      - targets: ['192.168.1.200:3035']
    relabel_configs:
      - target_label: project
        replacement: tapdata-prod

  # Keep the following jobs only after /metrics returns Prometheus metrics.
  - job_name: tapdata-agent
    metrics_path: /metrics
    static_configs:
      - targets: ['192.168.1.200:3036']
    relabel_configs:
      - target_label: project
        replacement: tapdata-prod

  - job_name: tapdata-api-server
    metrics_path: /metrics
    static_configs:
      - targets: ['192.168.1.200:3080']
    relabel_configs:
      - target_label: project
        replacement: tapdata-prod
For a multi-node deployment, add every node to the corresponding targets list. Do not create duplicate jobs for the same endpoint.
Configure Alertmanager
Use this local receiver to verify the connection between Prometheus and Alertmanager. It does not send external notifications. Before production use, replace it with actual receivers as described in Configure alert notifications.
route:
  receiver: local-only
  group_by: [alertname, project, instance, task_name]
  group_wait: 30s
  group_interval: 5m
  repeat_interval: 4h

receivers:
  - name: local-only
Configure Docker Compose
The example pins container versions. Validate upgrades in a test environment first. The Grafana password remains in .env, which has mode 600, instead of appearing in docker-compose.yml.
services:
  prometheus:
    image: prom/prometheus:v3.13.1
    container_name: prometheus
    restart: unless-stopped
    volumes:
      - ./prometheus.yml:/etc/prometheus/prometheus.yml:ro
      - ./tapdata-alert-rules.yml:/etc/prometheus/tapdata-alert-rules.yml:ro
      - prometheus_data:/prometheus
    ports:
      - "${MONITOR_BIND_IP:?set MONITOR_BIND_IP in .env}:9090:9090"
    command:
      - --config.file=/etc/prometheus/prometheus.yml
      - --storage.tsdb.path=/prometheus
      - --storage.tsdb.retention.time=30d

  alertmanager:
    image: prom/alertmanager:v0.33.1
    container_name: alertmanager
    restart: unless-stopped
    volumes:
      - ./alertmanager.yml:/etc/alertmanager/alertmanager.yml:ro
      - alertmanager_data:/alertmanager
    ports:
      - "${MONITOR_BIND_IP:?set MONITOR_BIND_IP in .env}:9093:9093"

  grafana:
    image: grafana/grafana:13.1.0
    container_name: grafana
    restart: unless-stopped
    environment:
      GF_SECURITY_ADMIN_USER: admin
      GF_SECURITY_ADMIN_PASSWORD: ${GRAFANA_ADMIN_PASSWORD:?set GRAFANA_ADMIN_PASSWORD}
      GF_USERS_ALLOW_SIGN_UP: "false"
    volumes:
      - grafana_data:/var/lib/grafana
    ports:
      - "${MONITOR_BIND_IP:?set MONITOR_BIND_IP in .env}:3000:3000"

volumes:
  prometheus_data:
  alertmanager_data:
  grafana_data:
Optional: Configure MongoDB monitoring
To monitor the MongoDB system database used by TapData:
-
Ask a MongoDB administrator to connect with an account that can manage users. Create a read-only monitoring account in
admin:use admin
db.createUser({
user: "tapdata_monitor",
pwd: "<strong-password>",
roles: [
{ role: "clusterMonitor", db: "admin" },
{ role: "read", db: "local" }
]
})clusterMonitorreads server and replica set status. Read access tolocalprovides Oplog information. Do not grant write access to TapData business databases. -
Add the MongoDB URI to
.env:.envMONGODB_URI=mongodb://tapdata_monitor:<url-encoded-password>@<mongo-host>:27017/admin?replicaSet=<replica-set-name>chmod 600 .envURL-encode passwords that contain characters such as
@,:,/,?, or#. Adjust the URI for standalone or TLS deployments, and remove replica set parameters that do not apply. -
Add
mongodb-exporterunderservicesindocker-compose.yml:services:
mongodb-exporter:
image: percona/mongodb_exporter:0.51.0
restart: unless-stopped
environment:
MONGODB_URI: ${MONGODB_URI:?set MONGODB_URI in .env}
command:
- --collector.diagnosticdata
- --collector.replicasetstatus
- --collector.dbstats
ports:
- "127.0.0.1:9216:9216"Port 9216 is bound only to the monitoring server. Prometheus reaches the exporter through its Compose service name, so operators do not need direct access to this port.
-
Add a scrape job under
scrape_configsinprometheus.yml:- job_name: mongodb
metrics_path: /metrics
static_configs:
- targets: ['mongodb-exporter:9216']
relabel_configs:
- target_label: project
replacement: tapdata-prodIf the exporter and Prometheus do not share a Compose network, replace the service name with an exporter address that Prometheus can reach.
You can validate exporter, Prometheus, and Grafana configuration against a separate test MongoDB first. For production monitoring, connect the exporter to the system database actually used by TapData, and verify account permissions, TLS, and replica set behavior. A standalone MongoDB that is not configured as a replica set does not provide replica set state or Oplog metrics.
For all exporter options, see the Percona mongodb_exporter reference.
Start the services
docker compose config --quiet
docker compose up -d
docker compose ps
Prometheus, Alertmanager, and Grafana should report Up. If MongoDB monitoring is configured, mongodb-exporter should also be Up. If Prometheus repeatedly restarts, run docker compose logs prometheus and check the configuration and rule-file paths.
Open the monitoring pages
From an operator workstation that can reach the monitoring server's private IP, open:
| Page | Address and sign-in | First check |
|---|---|---|
| Prometheus | http://<monitor-host-private-ip>:9090. Prometheus has no application login by default. If a reverse proxy is used, use its credentials. | Open Status > Target health and confirm required targets are UP. Open Alerts to review rule state. |
| Grafana | http://<monitor-host-private-ip>:3000. The username is admin; the password is GRAFANA_ADMIN_PASSWORD from .env, not a TapData password. | Add Prometheus, import a dashboard, and select the actual project, instance, and task. |
| Alertmanager | http://<monitor-host-private-ip>:9093. Alertmanager has no application login by default. | Review firing alerts, labels, and groups. Confirm that the receiver gets firing and resolved notifications. |
Prometheus and Alertmanager do not provide login authentication by default. Set MONITOR_BIND_IP to the monitoring server's private IP and allow only operator networks through a firewall or security group. Do not expose these ports directly to the internet. For cross-network access, use an authenticated reverse proxy with access control.
Step 3: Verify the monitoring path
Verify scrape targets
Open http://<monitor-host-private-ip>:9090/targets. Every configured job should be UP. Components that are not deployed do not need to appear. Fix configured DOWN targets or remove them from the configuration.
Run these queries in Prometheus:
# Whether the latest scrape of each target succeeded: 1 is success, 0 is failure.
up{project="tapdata-prod"}

# Number of successful targets.
sum(up{project="tapdata-prod"} == 1)

# Whether Flow Engine provides task status and lag metrics.
count(task_status{project="tapdata-prod",job="tapdata-flow-engine"})
count(task_cdc_delay_ms{project="tapdata-prod",job="tapdata-flow-engine"})
Do not interpret a count(...) result of 0 or no data as a healthy task with a value of zero. Confirm that the corresponding task type is active, and then inspect the Flow Engine endpoint directly:
curl -fsS http://<tapdata-host>:3035/actuator/prometheus \
  | grep -E '^# (HELP|TYPE) task_(status|active_db|cdc_delay_ms|node_process_data_ms|milestone_status|milestone_time)'
Use the result to decide which monitoring features to enable:
| Result | Conclusion and action |
|---|---|
Target is UP and the task_* queries return data | Enable the task dashboard and tapdata-tasks rules. Use a test task to verify state changes. |
Target is UP but no listed task_* metric exists while a task is running | The environment currently has component-level monitoring only. Do not treat No data panels or Inactive task rules as proof of task health. Use the TapData task monitoring page and confirm task metric availability with TapData Support. |
| Target is DOWN | Fix the network, port, metric path, or component process before interpreting any business metric. |
Verify MongoDB monitoring
If MongoDB monitoring is configured:
-
Confirm that the
mongodbtarget is UP. -
Run
mongodb_up{job="mongodb"}and confirm that the value is1. -
Check that the exporter returns MongoDB metrics:
curl -fsS http://127.0.0.1:9216/metrics \
| grep -E '^mongodb_(up|rs_myState|rs_members_(state|health)|ss_connections|ss_opcounters|ss_wt_cache_(bytes_currently_in_the_cache|maximum_bytes_configured)|oplog_stats_storageStats_storageSize)' -
For a replica set, compare
mongodb_rs_myState, member count, and connections withrs.status()anddb.serverStatus().connections.
up{job="mongodb"}=1 means only that Prometheus can collect exporter metrics. mongodb_up=1 confirms that the exporter can connect to MongoDB. If the endpoint provides only exporter metrics such as go_* and process_*, check the MongoDB URI, authentication database, TLS, network, and collection options (collectors).
Do not stop the MongoDB system database used by TapData or modify a production replica set to test alerts. During a maintenance window, you can stop and restore mongodb-exporter to test the exporter-down alert without affecting the database.
Verify alerts and dashboards
This section verifies only that rules, dashboards, and notifications work. For rule selection, notification routing, threshold maintenance, and routine checks, see Configure alerts and routine monitoring checks. For template downloads, imports, and panel interpretation, see Use the Grafana dashboards.
Prometheus does not include TapData rules by default. The tapdata-* groups in the screenshot appear only after you complete all of the following steps and apply the updated Prometheus configuration:
- Download the TapData Prometheus alert rules and save the file as
tapdata-alert-rules.yml. - Reference the file in
prometheus.ymlunderrule_files. - Mount the file at the corresponding Prometheus container path in
docker-compose.yml.
Then complete these checks:
-
Install and validate the rules. Then open Status > Rule health. Some Prometheus releases label this page Rules. Confirm that all groups load without errors. If the page is empty, check
rule_files, the container mount, anddocker compose logs prometheus.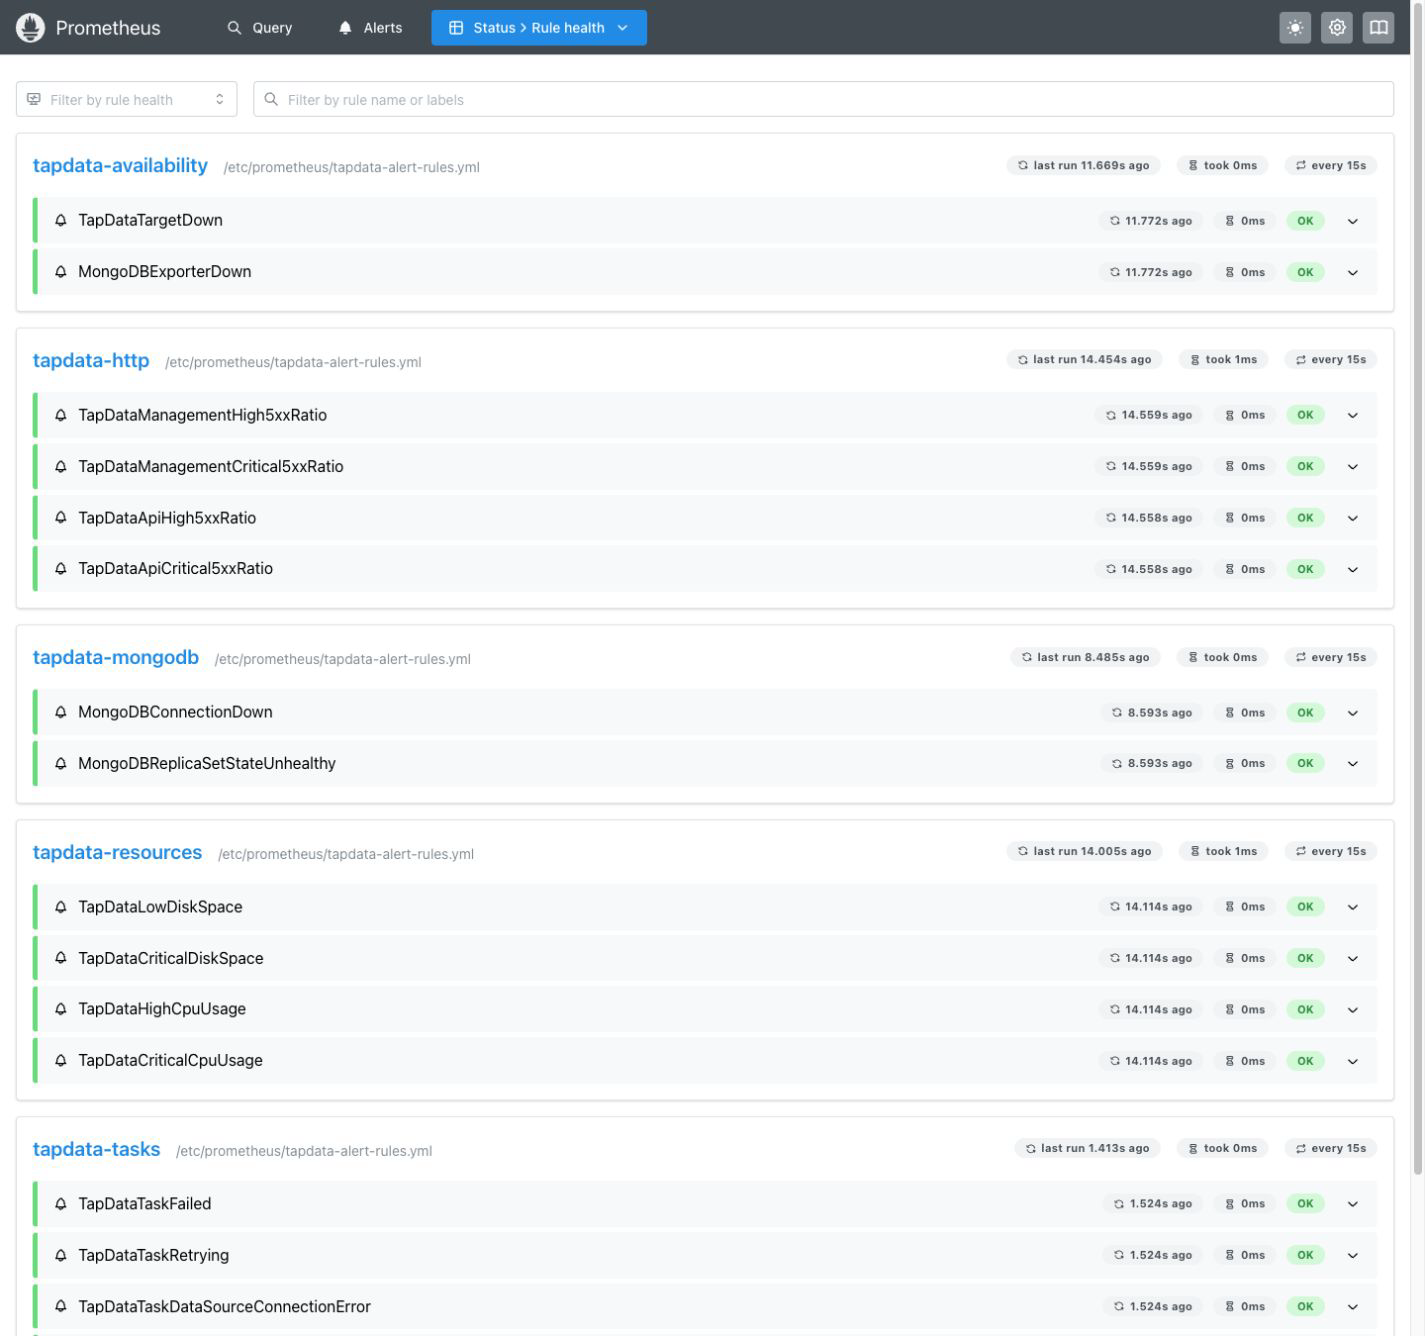
-
Open Alerts and confirm that Prometheus can evaluate the rules.
-
Open
http://<monitor-host-private-ip>:9093and confirm that Alertmanager is healthy and receives alerts from Prometheus. -
Add a Prometheus data source in Grafana with URL
http://prometheus:9090. Then download a template and import and validate the dashboard. -
Configure a real receiver and test the notification path. Visible charts or rule states do not prove that notifications work.
Next steps
- To decide whether a metric value or trend is unhealthy, see Metric reference and health assessment.
- To troubleshoot empty dashboards or learn where to start, see Use the Grafana dashboards.
- To configure thresholds, notification routing, and incident response, see Configure alerts and routine monitoring checks.
For configuration syntax, see the Prometheus documentation for configuration, alerting rules, and Alertmanager configuration.