Integrating Prometheus Monitoring
TapData enables exposing runtime metrics in Prometheus format, allowing seamless integration into existing monitoring systems for unified observability, trend analysis, and alerting. This guide details how to enable monitoring, collect component metrics, and integrate with Prometheus, with optional Grafana dashboards for visualization.
Background
TapData is a real-time data synchronization and integration platform that supports efficient data transfer, transformation, and integration across diverse data sources. It comprises core components—Management service, API Server, Agent, and Flow Engine—whose stability ensures task reliability and continuity.
To provide comprehensive platform monitoring, TapData offers Prometheus-based metrics. Components can expose metrics via configuration files or environment variables, accessible through HTTP endpoints for integration with observability platforms like Prometheus and Grafana. This enables collection, visualization, and alerting on metrics such as resource usage and task status.
TapData relies on MongoDB for metadata storage. For unified monitoring, use the open-source mongodb_exporter tool to convert MongoDB performance metrics (e.g., connections, operations, memory usage) into Prometheus-compatible format, integrating them with TapData metrics.
This approach creates a robust monitoring system covering TapData services and dependencies, enhancing observability and operational efficiency.
Prerequisites
TapData version should be 4.9.0 or higher.
Step 1: Enable Monitoring
1.1 Enable TapData Service Monitoring
Monitoring is disabled by default. To expose health and metrics endpoints for tools like Prometheus, enable it via configuration file or environment variables.
- Enable via configuration file
- Enable via environment variables
Log in to the TapData server and edit application.yml:
spring:
  # ... other configurations omitted ...
tapdata:
  # ... other configurations omitted ...
  metrics:
    enable: true         # Enable monitoring
    enginePort: 3035     # Flow Engine monitoring port, default 3035
    agentPort: 3036      # Agent monitoring port, default 3036
Log in to the TapData server and set:
export TAPDATA_MONITOR_ENABLE=true        # Enable monitoring
export TAPDATA_FE_MONITOR_PORT=3035       # Flow Engine monitoring port, default 3035
export TAPDATA_AGENT_MONITOR_PORT=3036    # Agent monitoring port, default 3036
For multi-node deployments, apply configurations on all nodes.
1.2 Enable MongoDB Monitoring
TapData uses MongoDB for configuration and task metadata. Use mongodb_exporter to extract MongoDB metrics and convert them to Prometheus format for unified monitoring.
-
Log in to the MongoDB instance and create a user with the
clusterMonitorrole to read cluster status and metrics.# Replace with desired username and password
use admin
db.createUser({
user: "tapdata_monitor",
pwd: "your_password",
roles: [
{ role: "clusterMonitor", db: "admin" },
{ role: "read", db: "local" }
]
}) -
Download the binary from the mongodb_exporter releases page.
This example uses version 0.47.1.
-
Extract the file and navigate to the directory.
# Replace with actual package name
tar -xzvf mongodb_exporter-0.47.1.linux-amd64.tar.gz
cd mongodb_exporter-0.47.1.linux-amd64 -
Start
mongodb_exporterin the background, logging toexporter.log.# Set read-only user credentials
export MONGODB_USER=tapdata_monitor
export MONGODB_PASSWORD=your_password
# Start in background; replace --mongodb.uri with actual connection
nohup ./mongodb_exporter \
--mongodb.uri="mongodb://192.168.1.18:27017" \
--collector.diagnosticdata \
--collector.replicasetstatus \
--collector.replicasetconfig \
--collector.dbstats \
--collector.dbstatsfreestorage \
--collector.topmetrics \
--collector.currentopmetrics \
--collector.indexstats \
--collector.profile \
--collector.shards \
--collector.pbm \
--no-compatible-mode \
> exporter.log 2>&1 &tipOn success, it listens on port 9216 at
/metrics. See mongodb_exporter docs for configuration and metrics details.
Step 2: Integrate with Prometheus/Grafana
This example uses Docker Compose for Prometheus. Install Docker if needed, per the official Docker docs.
-
On a server networked with TapData, create a directory:
mkdir prometheus && cd prometheus.Assume the server is 192.168.1.100; TapData nodes are 192.168.1.200 and 192.168.1.201.
-
Create
docker-compose.ymlwith Prometheus and Grafana services:version: '3.7'
services:
prometheus:
image: prom/prometheus:latest
container_name: prometheus
volumes:
- ./prometheus.yml:/etc/prometheus/prometheus.yml
- prometheus_data:/prometheus # Data persistence
ports:
- "9090:9090"
command:
- '--config.file=/etc/prometheus/prometheus.yml'
- '--storage.tsdb.path=/prometheus'
- '--web.console.libraries=/etc/prometheus/console_libraries'
- '--web.console.templates=/etc/prometheus/consoles'
- '--storage.tsdb.retention.time=30d' # Retain data for 30 days
grafana:
image: grafana/grafana:latest
container_name: grafana
ports:
- "3000:3000"
environment:
- GF_SECURITY_ADMIN_USER=admin
- GF_SECURITY_ADMIN_PASSWORD=admin
volumes:
- grafana_data:/var/lib/grafana # Data persistence
volumes:
prometheus_data:
grafana_data:Importantprometheus_data: Stores Prometheus metrics to prevent data loss on container restart.grafana_data: Persists Grafana configurations, dashboards, and data sources. Without persistence,docker compose downwill delete all data, losing configurations!
-
Create
prometheus.ymlwith scrape jobs for TapData and MongoDB, supporting multi-node and custom labels:scrape_configs:
- job_name: 'tapdata-management'
metrics_path: /actuator/prometheus
scrape_interval: 5s
relabel_configs: # Optional: add custom labels
- target_label: 'env'
replacement: 'dev'
static_configs:
- targets:
- '192.168.1.200:3030' # Replace with actual IP
- '192.168.1.201:3030' # For multi-node; remove for single
- job_name: 'tapdata-flow-engine'
metrics_path: /actuator/prometheus
static_configs:
- targets:
- '192.168.1.200:3035'
- '192.168.1.201:3035'
- job_name: 'tapdata-api-server'
metrics_path: /metrics
static_configs:
- targets:
- '192.168.1.200:3080'
- '192.168.1.201:3080'
- job_name: 'tapdata-agent'
metrics_path: /metrics
static_configs:
- targets:
- '192.168.1.200:3036'
- '192.168.1.201:3036'
- job_name: 'mongodb'
metrics_path: /metrics
static_configs:
- targets:
- '192.168.1.200:9216' -
Start containers:
docker compose up -dPersistence NoteWith the above configuration, Prometheus and Grafana data persist in Docker volumes, surviving container restarts.
-
Access Prometheus at
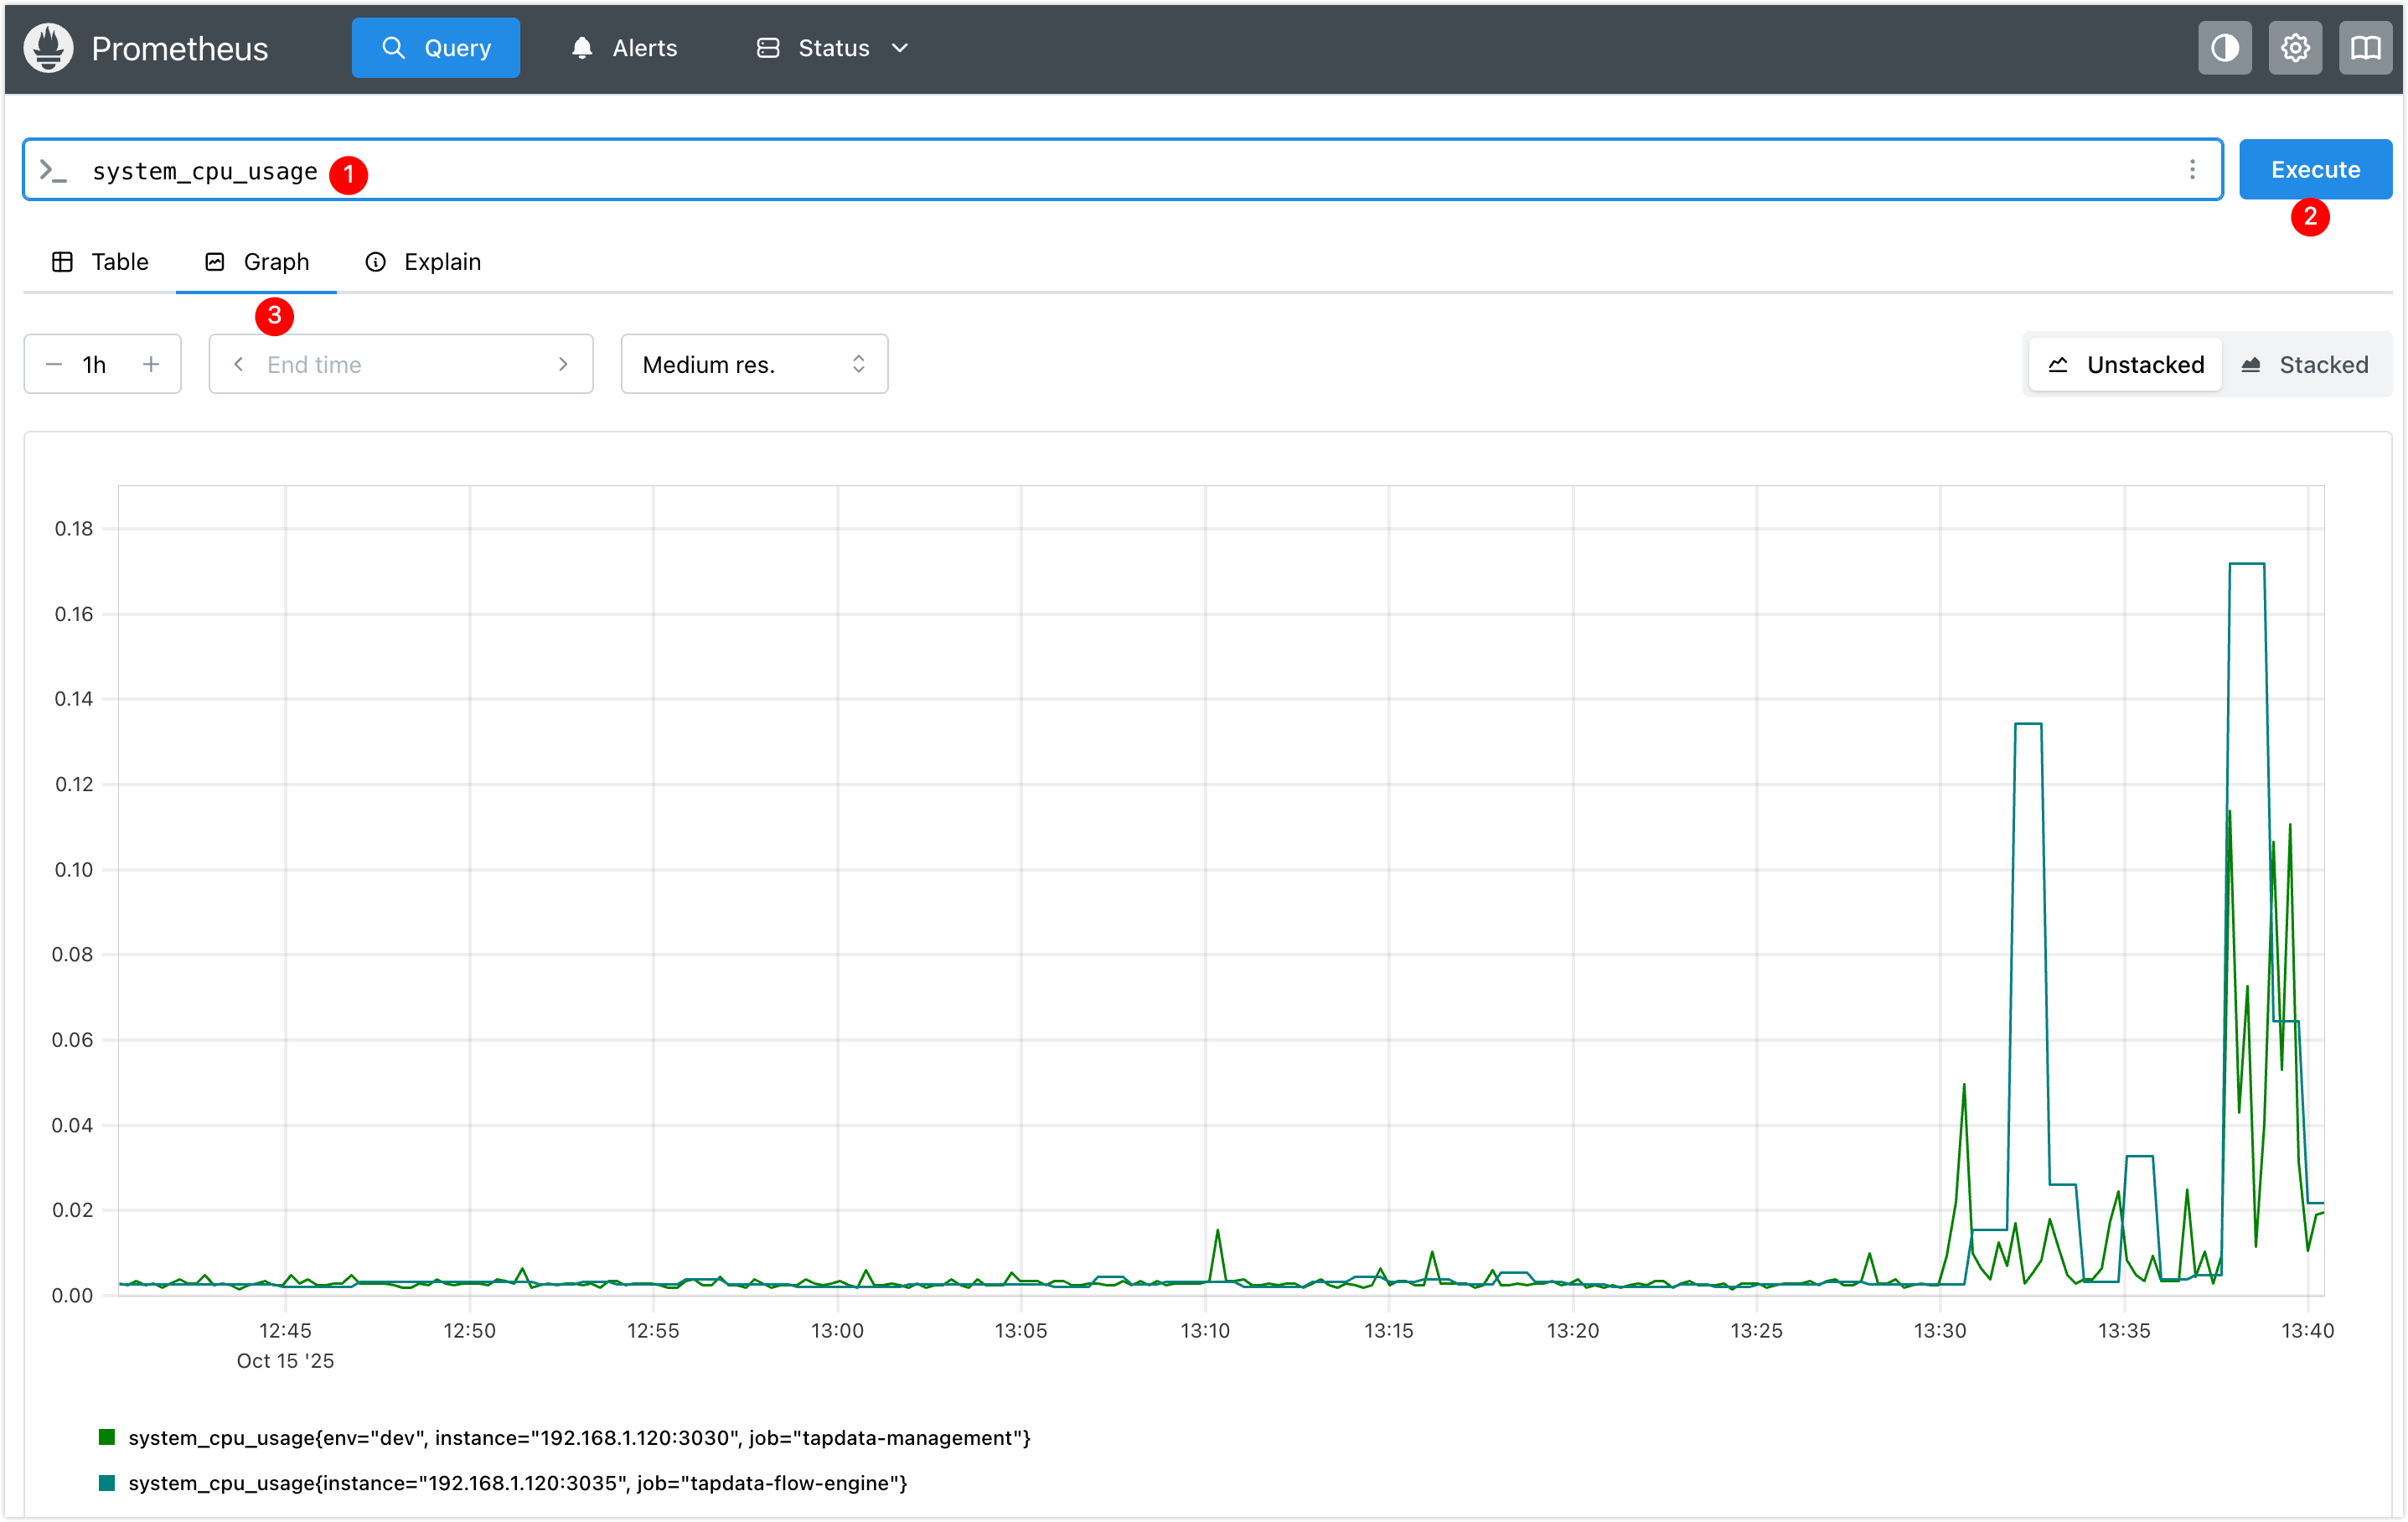
http://192.168.1.100:9090and query a metric likesystem_cpu_usageto verify setup.
-
Access Grafana at
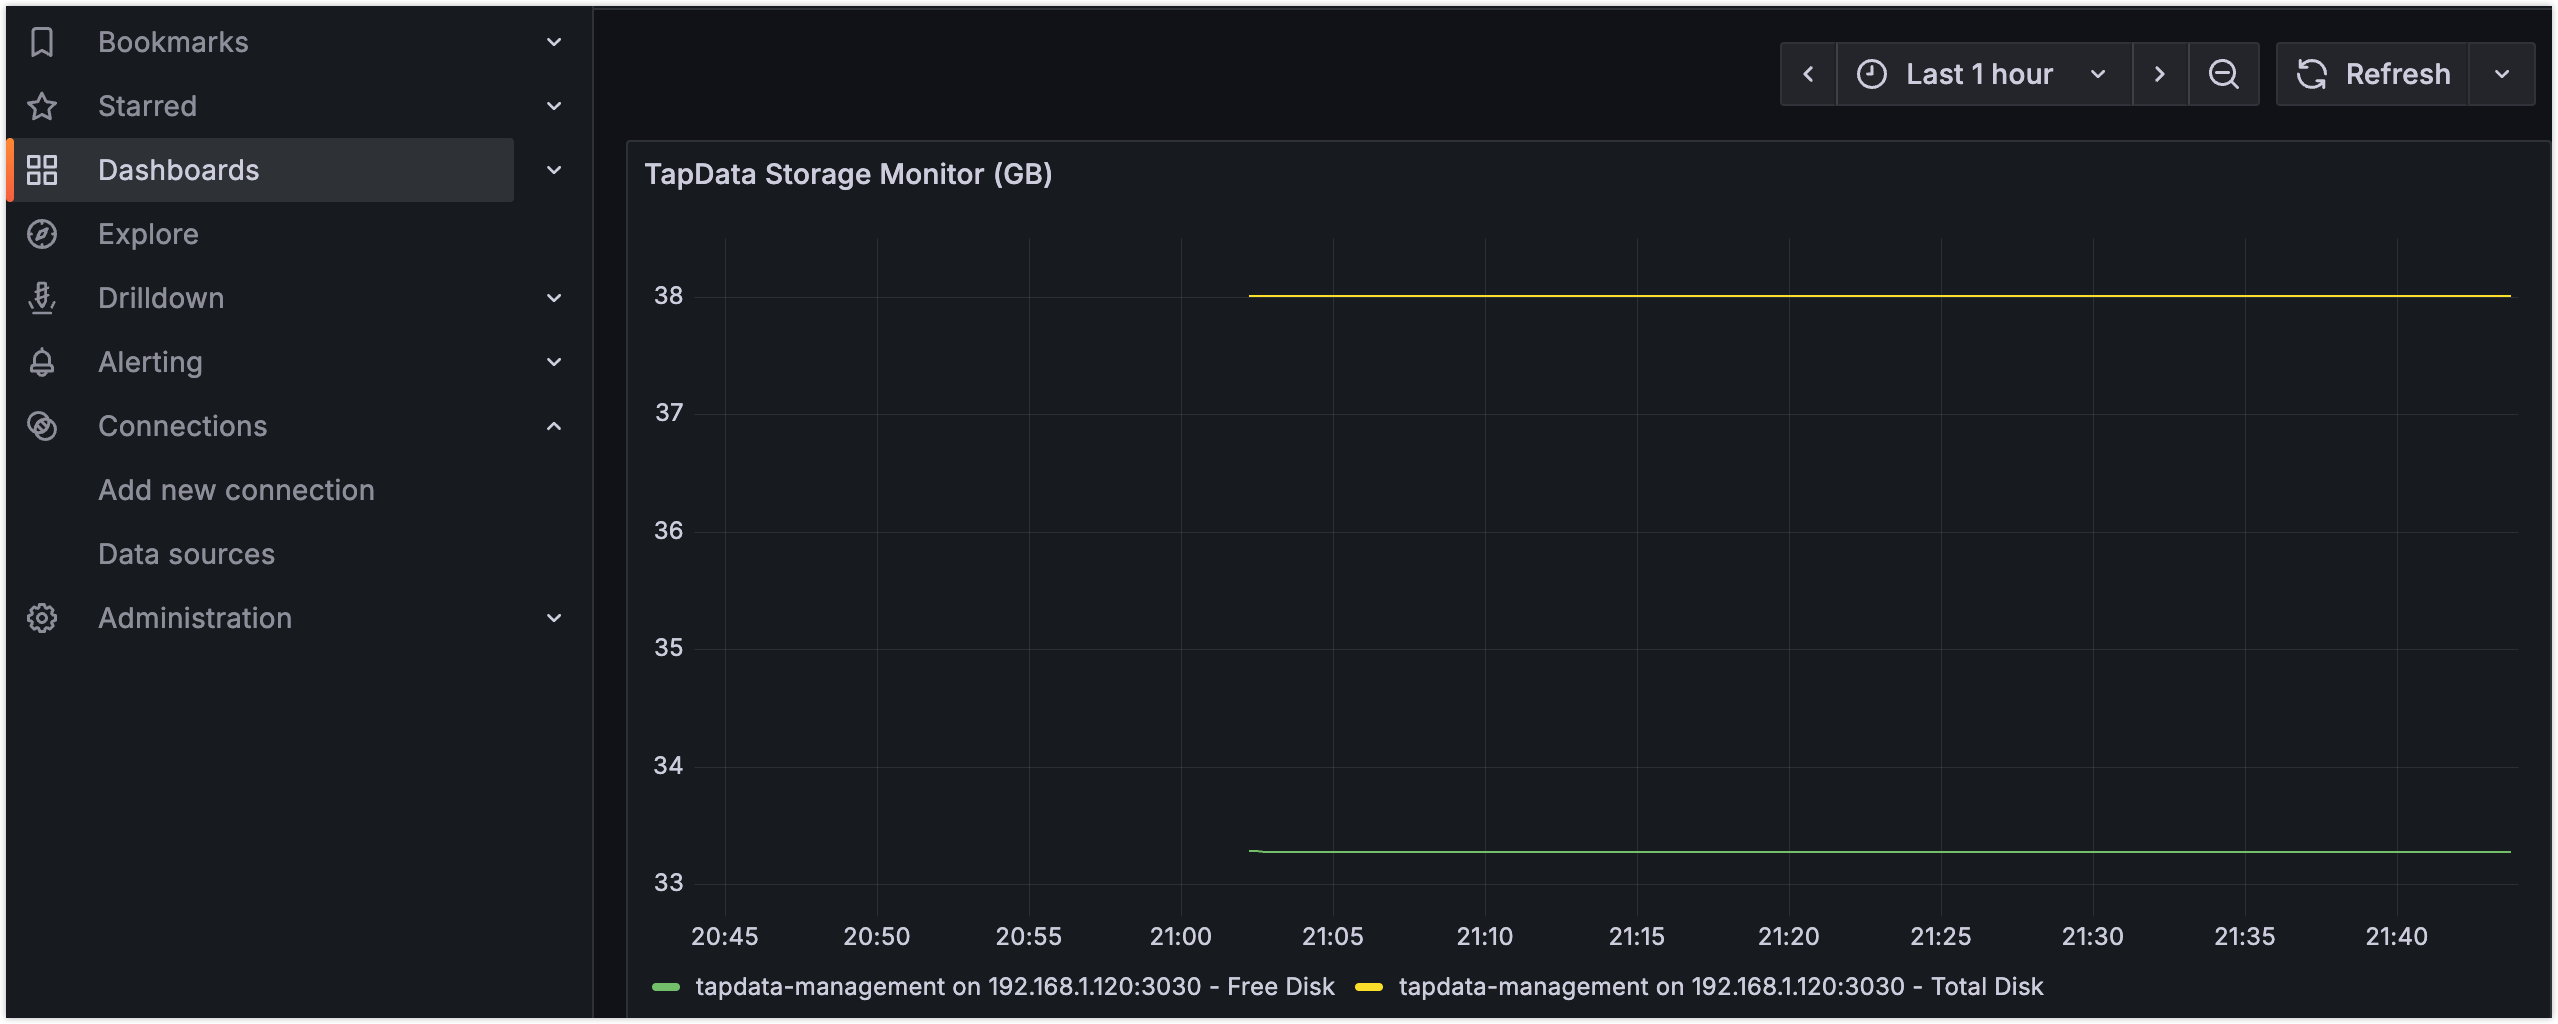
http://192.168.1.100:3000, log in, reset the default password, and add Prometheus as a data source athttp://192.168.1.100:9090.
The example below dashboards TapData Management disk metrics. See Grafana Dashboards guide for more.
 tip
tipImport our Grafana dashboard templates for quick, professional monitoring views.
Appendix
Grafana Dashboard Templates
To streamline TapData monitoring, we provide pre-built Grafana dashboard templates for professional views without starting from scratch.
| Template Name | Scope | Download Link |
|---|---|---|
| TapData Service | Task status, resources, health | TapData-Service-Template.zip |
| API Service | Request stats, API performance | API-Service-Template.zip |
| MongoDB | Query performance, oplog, stats | Percona MongoDB Dashboard |
Usage
- Download Template: Get the JSON file from the links above.
- Import to Grafana: Grafana → + icon → Import dashboard.
- Set Data Source: Select the Prometheus data source.
- Adjust Variables: Modify query variables for your environment.
Preview
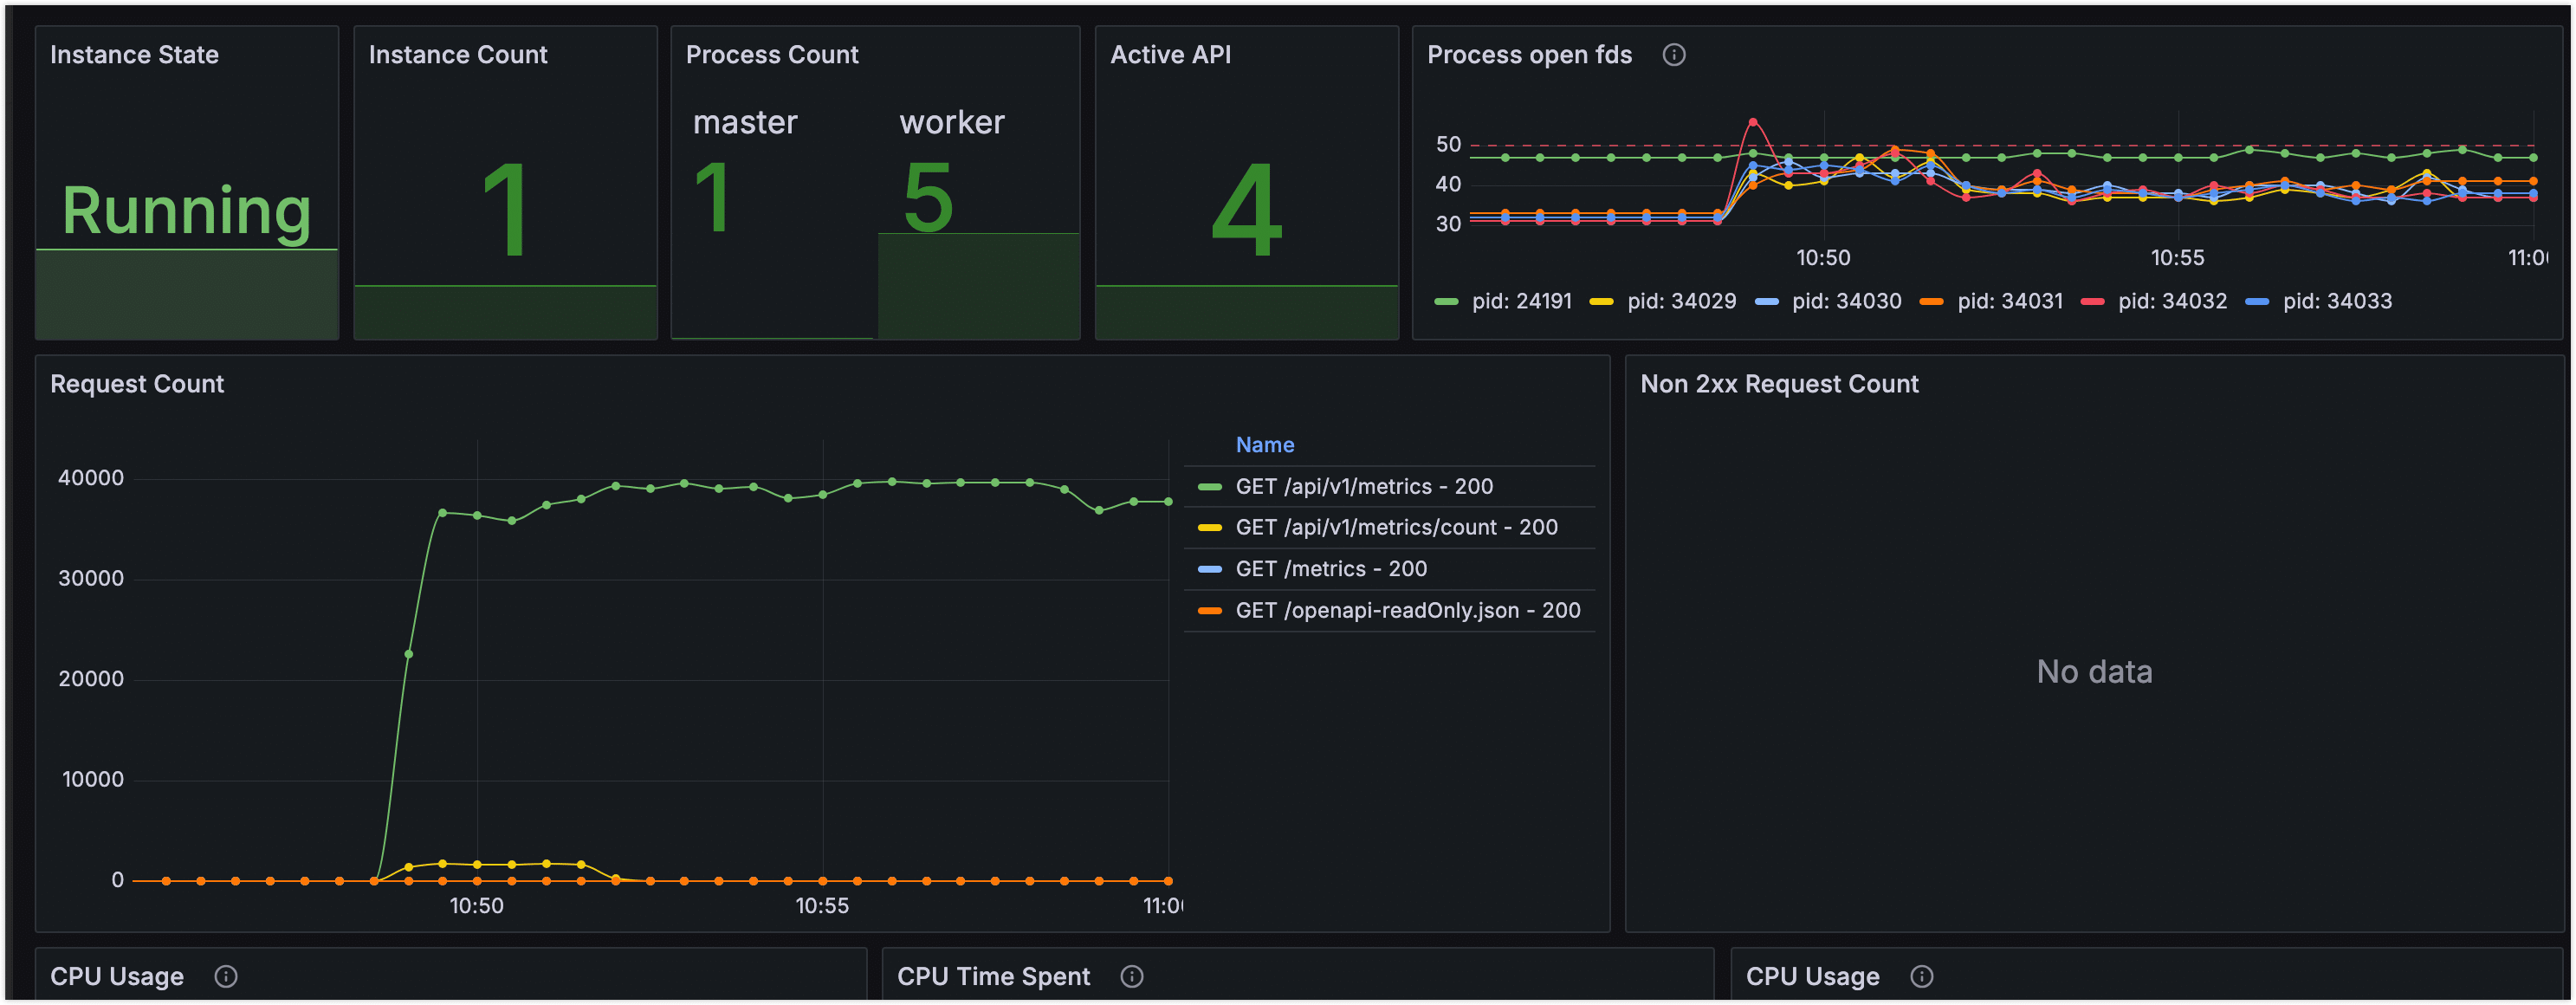
- TapData Monitoring
- API Monitoring
- MongoDB Monitoring

Includes: Task latency, node status, resource usage

Includes: Request volume, response time, error rate

Includes: Query performance, connections, oplog status
If dashboards show no data, verify Prometheus data source configuration, query variable alignment with labels, and endpoint accessibility.
Health Endpoints and Metrics
Health Endpoints
TapData components provide unauthenticated HTTP GET health endpoints, returning 200 for healthy services. Examples:
-
TapData Management:
curl http://127.0.0.1:3030/health{
"reqId": "47f18971-92d5-48ab-9bfd-581f39988e06",
"ts": 1758081846300,
"code": "ok"
} -
TapData ApiServer:
curl http://127.0.0.1:3080/status{
"status": "UP"
} -
TapData Agent:
curl http://127.0.0.1:3036/health(If monitoring disabled, check PID.){
"status": "ok",
"date": "2025-09-17T04:15:00.281Z",
"pid": 78193,
"platform": "darwin"
} -
TapData Flow Engine:
curl http://127.0.0.1:3035/actuator/health(If disabled, check PID.){
"status": "UP",
"components": {
"diskSpace": {
"status": "UP",
"details": {
"total": 3939047620608,
"free": 393134940160,
"threshold": 10485760,
"path": "/home/daguozb/package2/tapdata/.",
"exists": true
}
},
"ping": {
"status": "UP"
},
"ssl": {
"status": "UP",
"details": {
"validChains": [],
"invalidChains": []
}
}
}
}
Available Metrics
Metrics are exposed in Prometheus format via:
- TapData Management:
http://127.0.0.1:3030/actuator/prometheus - TapData Flow Engine:
http://127.0.0.1:3035/actuator/prometheus - TapData Agent:
http://127.0.0.1:3036/metrics - TapData ApiServer:
http://127.0.0.1:3080/metrics
Detailed Metrics List (Click to Expand)
TapData Management
| Metric Name | Description |
|---|---|
| up | Process uptime status |
| disk_free_bytes | Available disk space (bytes) |
| disk_total_bytes | Total disk space (bytes) |
| http_server_requests_active_seconds_count | Active requests count |
| http_server_requests_active_seconds_sum | Cumulative active request duration (seconds) |
| http_server_requests_active_seconds_max | Max active request duration (seconds) |
| http_server_requests_seconds_count | Total requests count |
| http_server_requests_seconds_sum | Total request processing time |
| process_cpu_time_ns_total | JVM CPU time used |
| process_cpu_usage | JVM CPU usage rate |
| process_files_open_files | Open file handles by JVM |
| system_cpu_count | System CPU cores |
| system_cpu_usage | System CPU usage rate |
| system_load_average_1m | 1-minute system load average |
| jvm_memory_used_bytes | Memory used in areas (bytes): Heap (G1 Eden, Old Gen, Survivor); Non-heap (CodeCache, Compressed Class, Metaspace) |
| jvm_buffer_memory_used_bytes | Direct memory usage |
TapData Flow Engine
| Metric Name | Description |
|---|---|
| up | Process uptime status |
| disk_free_bytes | Available disk space (bytes) |
| disk_total_bytes | Total disk space (bytes) |
| process_cpu_time_ns_total | JVM CPU time used |
| process_cpu_usage | JVM CPU usage rate |
| process_files_open_files | Open file handles by JVM |
| system_cpu_count | System CPU cores |
| system_cpu_usage | System CPU usage rate |
| system_load_average_1m | 1-minute system load average |
| jvm_memory_used_bytes | Memory used in areas (bytes): Heap (G1 Eden, Old Gen, Survivor); Non-heap (CodeCache, Compressed Class, Metaspace) |
| jvm_memory_committed_bytes | Committed JVM memory (bytes) |
| jvm_buffer_memory_used_bytes | Direct memory usage |
TapData Agent
| Metric Name | Description |
|---|---|
| up | Process uptime status |
| disk_free_bytes | Available disk space (bytes) |
| disk_total_bytes | Total disk space (bytes) |
| process_cpu_time_ns_total | CPU time used |
| process_cpu_usage | CPU usage rate |
| process_files_open_files | Open file handles |
| system_cpu_count | System CPU cores |
| system_cpu_usage | System CPU usage rate |
| system_load_average_1m | 1-minute system load average |