Performance Benchmarks
This benchmark summarizes TapData's real-world performance across mainstream data sources. It reflects production-like workloads—including full sync, incremental CDC, and mixed writes—validating the platform’s ability to handle high-throughput, low-latency pipelines at scale.
Overview
A high-level snapshot of TapData’s performance across full sync, incremental CDC, and mixed DML workloads.
ClickHouse supports append-only operations and is excluded from CDC and DML tests.
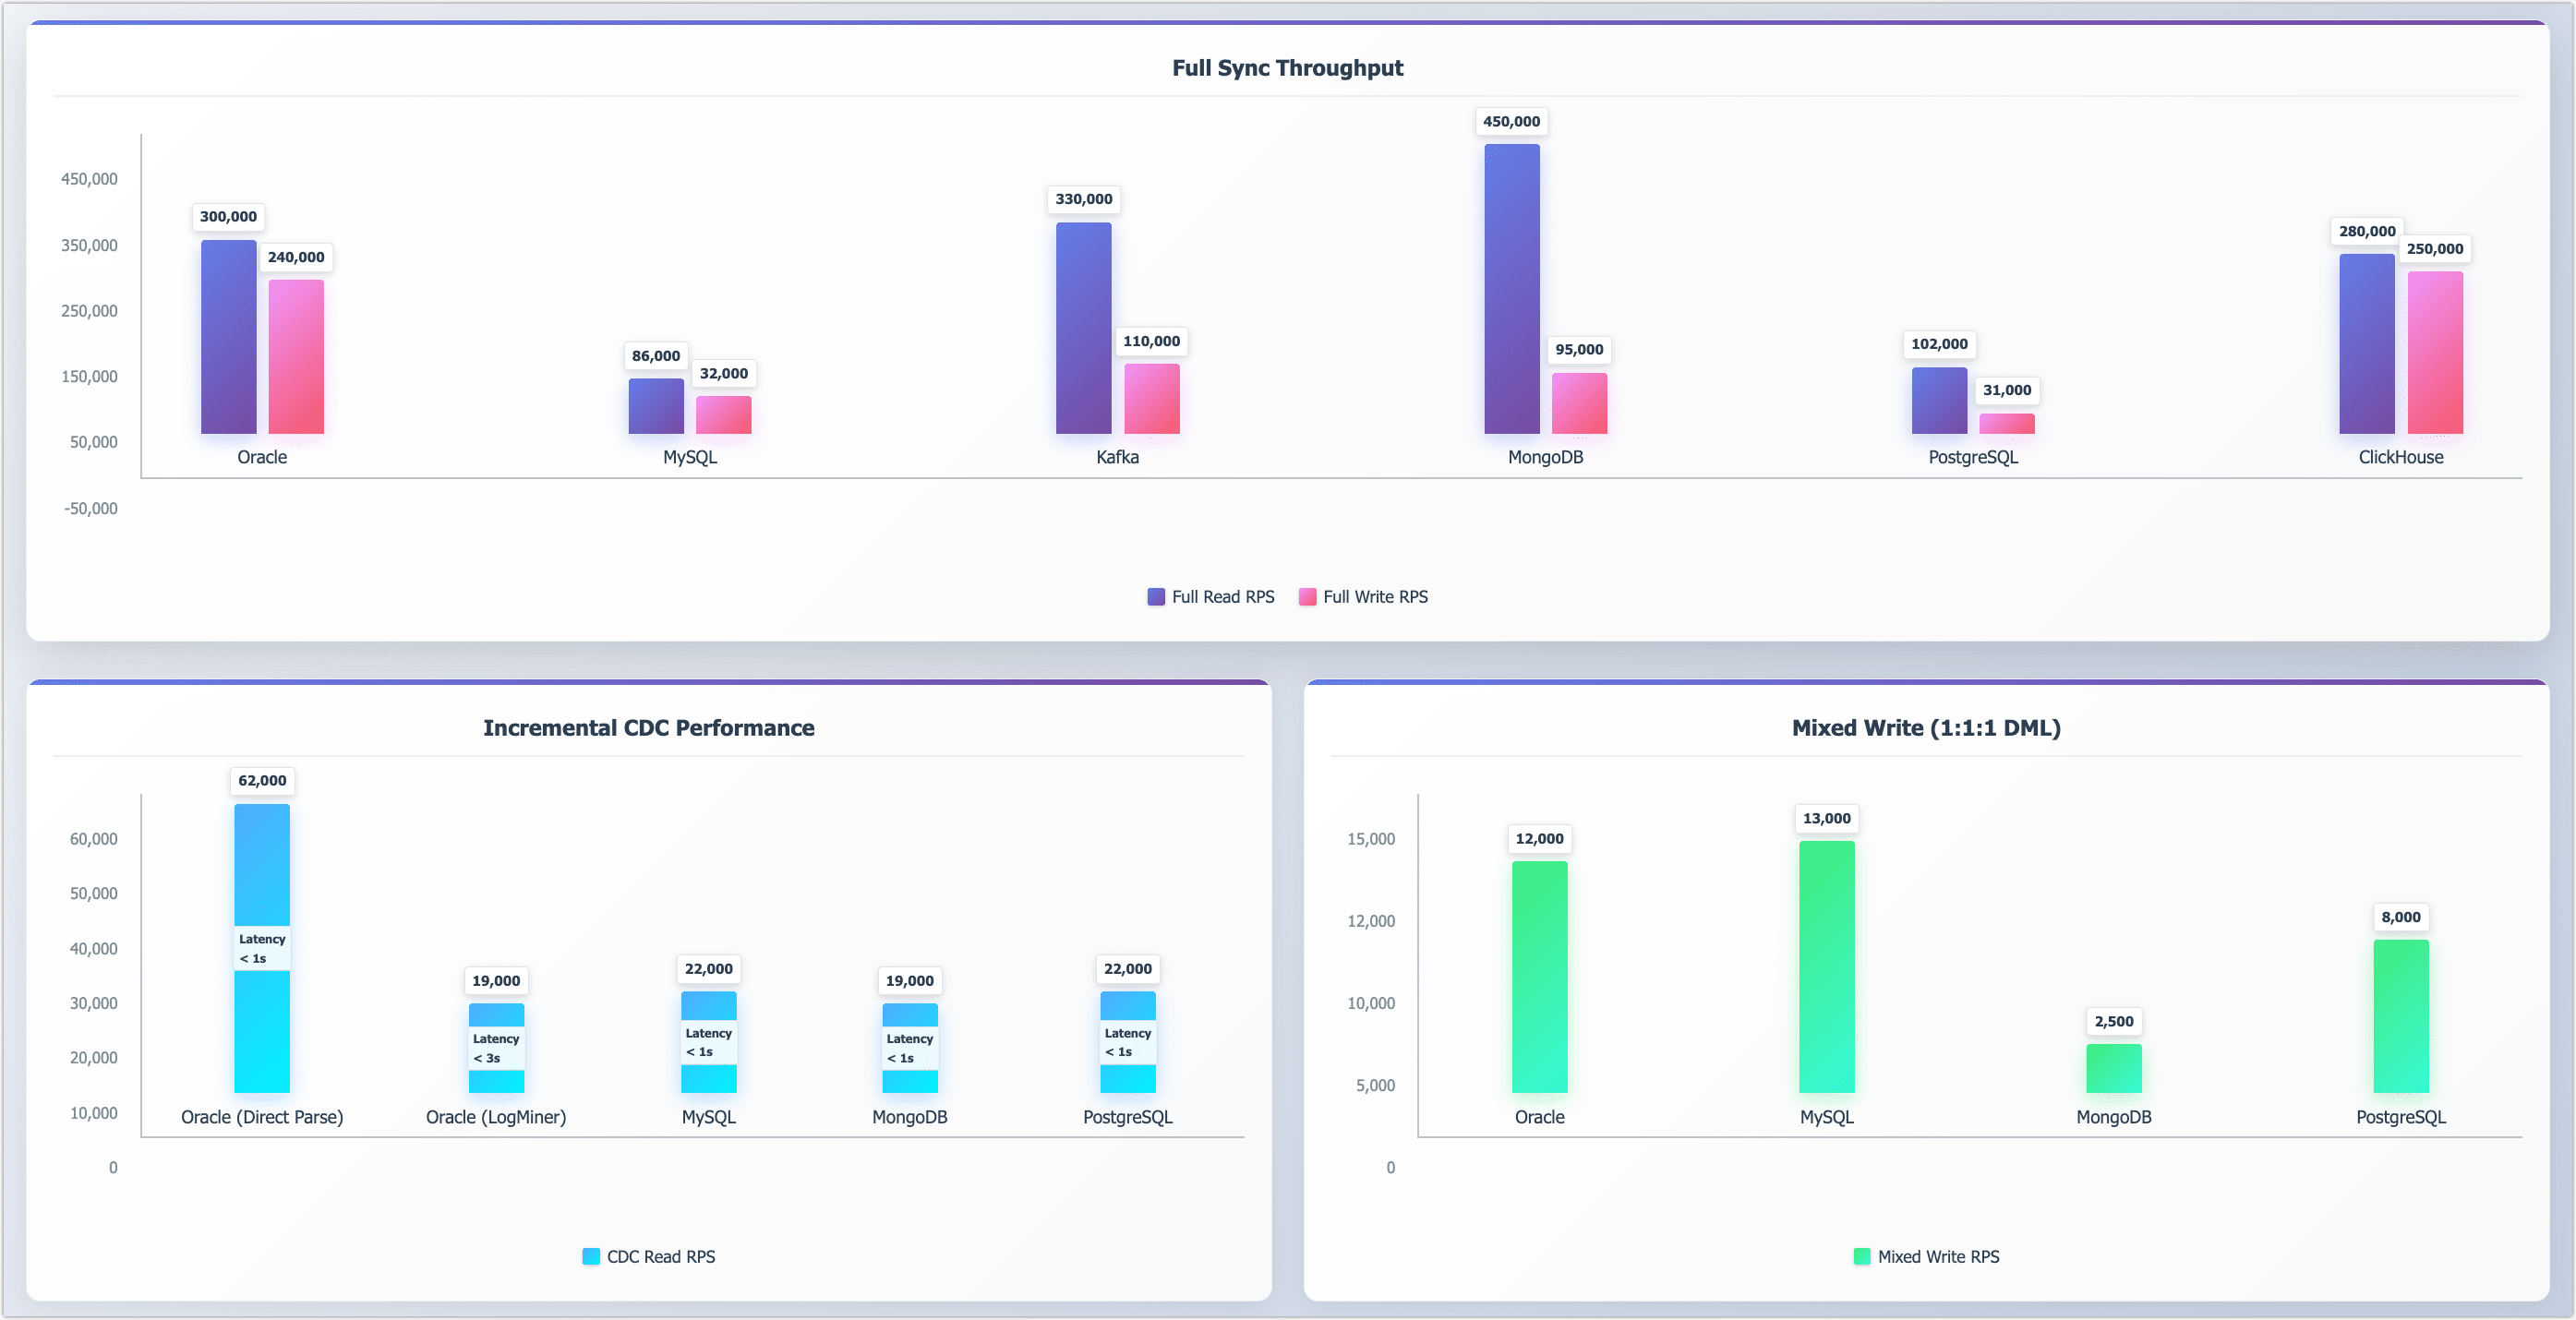
Full Sync Throughput
TapData achieves strong full-sync performance across both structured and unstructured data systems. The following table shows read and write throughput measured in records per second (RPS), based on 1KB records with ~50 fields.
| Data Source | Full Read RPS | Full Write RPS |
|---|---|---|
| Oracle | 300,000 | 240,000 |
| MySQL | 86,000 | 32,000 |
| Kafka | 330,000 | 110,000 |
| MongoDB | 450,000 | 95,000 |
| PostgreSQL | 102,000 | 31,000 |
| ClickHouse | 280,000 | 250,000 |
Incremental Sync (CDC)
TapData supports change data capture (CDC) with consistently high throughput and low latency across traditional and NoSQL systems.
| Data Source | CDC Read RPS | P99 latency |
|---|---|---|
| Oracle (Direct Parse) | 62,000 | < 1s |
| Oracle (LogMiner) | 19,000 | < 3s |
| MySQL | 22,000 | < 1s |
| MongoDB | 19,000 | < 1s |
| PostgreSQL | 22,000 | < 1s |
- P99 latency indicates the maximum delay experienced by 99% of change events.
- TapData supports both Oracle LogMiner and native log parsing; the latter delivers higher throughput for high-frequency scenarios. Learn more.
Mixed Load Performance
To simulate transactional behavior, we issued INSERT, UPDATE, and DELETE operations in a 1:1:1 ratio. TapData sustained stable throughput across major targets.
| Data Target | Mixed Write RPS |
|---|---|
| Oracle | 12,000 |
| MySQL | 13,000 |
| MongoDB | 2,500 |
| PostgreSQL | 8,000 |
Engine-Level Capacity
Under synthetic loads with 1KB records, a single TapData engine instance sustained up to 450,000 RPS—demonstrating strong performance and scalability in high-concurrency scenarios.
Key Takeaways
- Real-time CDC with low-latency support across relational and NoSQL databases
- High throughput: Up to 450K RPS for full sync, 60K+ RPS for incremental reads
- Mixed DML support: Stable performance for real-world transactional workloads
- Flexible CDC modes: Choose Oracle parsing mode based on performance/ops needs
About This Report
These results are based on TapData v3.7.0, tested under typical enterprise configurations.
This benchmark evaluates TapData’s performance across full sync, incremental CDC, and mixed DML workloads—validating its ability to handle high-throughput, low-latency pipelines at scale.
Test Scope
- Full sync throughput (initial batch replication)
- Incremental CDC read/write performance
- Mixed write throughput (DML: INSERT, UPDATE, DELETE in a 1:1:1 ratio)
- Engine scalability under concurrent workloads
Test Environment
- TapData Version: v3.7.0
- TapData Server: Alibaba Cloud ecs.u1-c1m2.4xlarge (16 vCPU, 32 GB RAM, 300 GB ESSD)
- TapData Memory Allocation: JVM configured via -Xmx with 16 GB for engine, 8 GB for management; metadata database allocated 4 GB via --wiredTigerCacheSizeGB
- Database Servers: Most databases use ecs.u1-c1m2.2xlarge (8 vCPU, 16 GB RAM) except Oracle which uses ecs.ebmhfc6.20xlarge (80 vCPU, 192 GB RAM)
Database Configurations
All databases use ESSD storage and are configured with the following system optimizations:
ulimit -n 655350
sysctl -w net.core.somaxconn=1024
sysctl -w net.core.netdev_max_backlog=5000
sysctl -w net.ipv4.tcp_max_syn_backlog=8192
Database-Specific Settings:
- Oracle 11g (Single node): Online redo log files increased to 4GB (vs. default 512MB) for smoother writes and stable incremental read performance
- ClickHouse 24.5.3.5 (Single node): Memory usage limit increased to 10GB
- MongoDB 6.0.15 (Replica set, single node): Storage cache memory set to 12GB
- MySQL 8.0 (Single node): InnoDB buffer pool set to 8GB with optimized log and flush settings
- Kafka 3.6 (Single broker with ZooKeeper): Compression set to Snappy, PLAIN transport (no encryption), ACK set to write to primary partition only
- SQL Server 2016 (Windows OS, Single node): Default configuration
- PostgreSQL 12 (Single node): Default configuration with Pgoutput as CDC plugin
- Elasticsearch 7 (Single node): Default configuration
- Redis 7 (Single node): Default configuration
Results may vary depending on hardware, deployment mode, and connector settings.