Performance Testing
This document aims to detail the methods and steps for conducting performance tests on TapData. We will explore how to accurately assess TapData's data processing capabilities, response times, and system stability under various conditions. This helps you understand TapData's performance under different loads, allowing for better resource planning and configuration optimization.
Testing Environment
- Operating System: CentOS 7 64-bit
- CPU: 12 cores
- Memory: 96 GB
Testing Methods
To ensure a comprehensive and accurate evaluation of TapData's performance, we will use the following testing methods:
-
Synchronization Task Creation.
Create data synchronization tasks according to the planned test types, including full and incremental synchronizations, to fully assess synchronization performance.
-
Simulate High-Intensity Data Writes.
Continuously execute high-intensity data write operations through automation scripts at the source database end, ensuring the data flow into the source database meets the test requirements.
-
Monitor Data Synchronization at the Target End.
Observe and record the data changes and writing speed at the target database end to confirm if the target can effectively and accurately handle data synchronization.
-
Data Consistency Verification.
Ensure data consistency between the source and target databases under high load, including verifying data integrity and synchronization accuracy, ensuring no data loss or erroneous synchronizations.
These steps will allow us to comprehensively evaluate TapData's data processing capabilities and stability under high load conditions. Additionally, this method will help identify potential performance bottlenecks, providing a basis for subsequent optimizations.
Test Metrics Explanation
| Metric | Description |
|---|---|
| Sync RPS | Records Per Second measures the speed and performance of data transfer by indicating the number of records processed each second. |
| 99th Latency | 99% of operations have a maximum delay of this value, measured in milliseconds. Assumes a value of 100 milliseconds means 99% of requests are processed within this time. |
| 95th Latency | 95% of operations have a maximum delay of this value, measured in milliseconds. |
| Average Latency | Average latency distribution, measured in milliseconds. |
Test Results
To ensure the accuracy and applicability of performance test results, we will conduct tests across various database architectures and in both homogeneous and heterogeneous data environments. This diverse testing approach helps comprehensively assess TapData's performance across different scenarios and connections.
Source Database: MongoDB
Environment Description
-
MongoDB Instance: A sharded cluster with 3 nodes, including 12 fields in the collection structure as shown below, with no indexes other than
_id. An automation script will perform data insertion operations at a rate of 11,000 rows per second, with incremental multi-thread writing enabled (4 threads).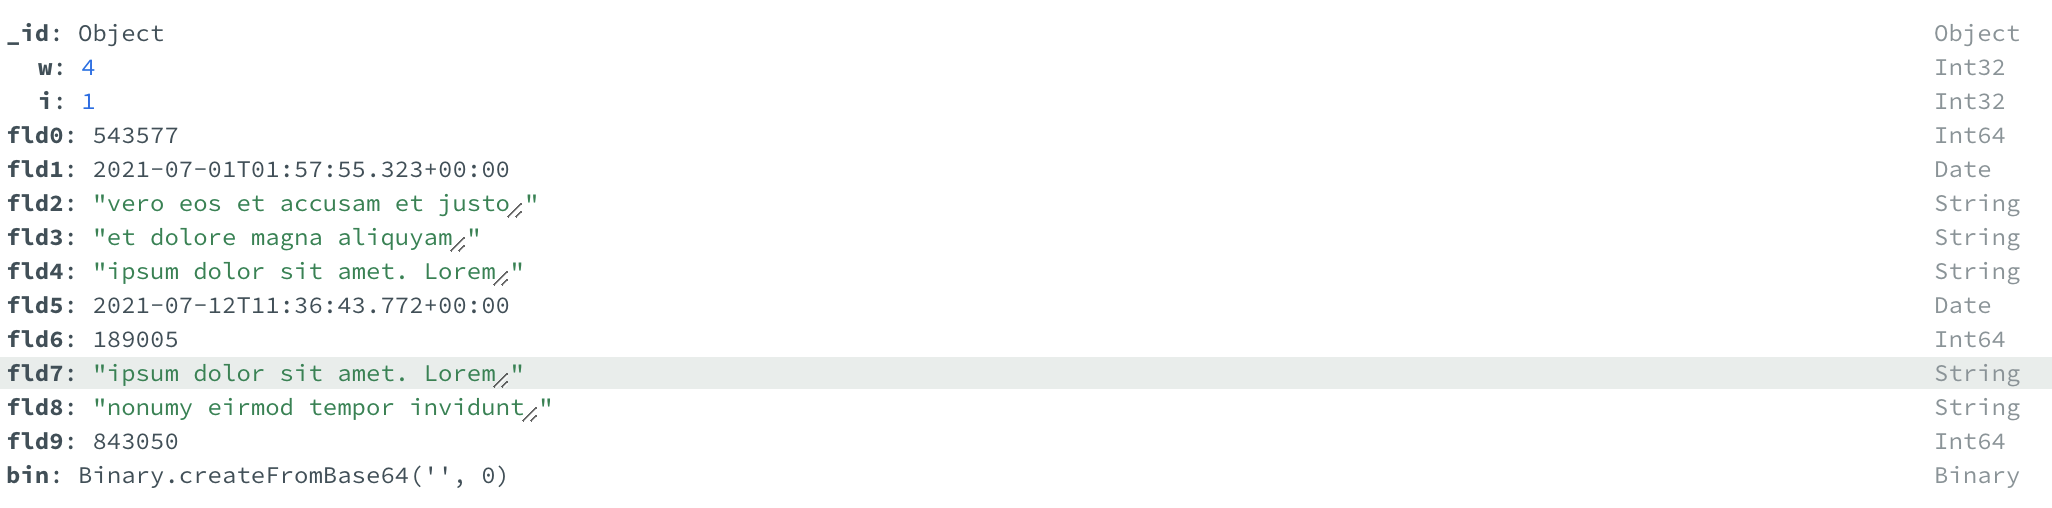
-
ElasticSearch Instance: A single-node instance running in Docker, with initial and maximum heap memory set to 4GB.
-
Redis Instance: A single-node instance running in Docker, with 12 cores and 48GB of memory.
Test Results
Results of real-time synchronization from a MongoDB source to different target databases are as follows:
| Target Database | Incremental Rows Written | Total Increment Time | Average Sync RPS | 99th Latency | 95th Latency | Average Latency |
|---|---|---|---|---|---|---|
| MongoDB | 5.1 million | 438 seconds | 11,664 | 2,000 ms | 1,900 ms | 1,163 ms |
| ElasticSearch | 3.1 million | 261 seconds | 11,608 | 1,700 ms | 1,500 ms | 980 ms |
| Redis | 6.7 million | 577 seconds | 11,592 | 1,600 ms | 1,300 ms | 781 ms |
Source Database: MySQL
Environment Description
-
MySQL Instance: Machine equipped with 12 cores and 48GB memory, with no indexes other than
CUSTOMER_ID. Table structure as shown:CREATE TABLE customer(
CUSTOMER_ID bigint PRIMARY KEY,
CITY VARCHAR(100),
AGE INT,
FIRST_NAME VARCHAR(150),
LAST_NAME VARCHAR(150),
DATE_OF_BIRTH DATETIME,
JOB VARCHAR(150),
EMAIL VARCHAR(100),
ZIP VARCHAR(10),
PHONE VARCHAR(40)
);Data will continuously be inserted via a stored procedure to simulate incremental data generation:
DELIMITER //
CREATE PROCEDURE CUSTOMER_INSERT_DATA(IN DATA_COUNT INT,IN BATCH_SIZE INT)
BEGIN
    DECLARE i INT default 1;
    DECLARE MAX_ID INT;
    select max(test.customer.CUSTOMER_ID) from test.customer into MAX_ID;
    IF MAX_ID IS NULL THEN
        SET MAX_ID = 0;
    END IF;
    SET autocommit =0;
    WHILE i <= DATA_COUNT do
        INSERT INTO customer(CUSTOMER_ID, CITY, AGE, FIRST_NAME, LAST_NAME, DATE_OF_BIRTH, JOB, EMAIL, ZIP, PHONE)
            VALUES (MAX_ID+i,'Oppenheim',18,'Lambert','Sauer',now(),'Vertreter / Vertreterin','rushland2003@live.com','13480','+49-4611-41132053');
        IF(mod(i,BATCH_SIZE)=0)
            THEN commit;
        END IF;
        SET i = i+1;
    END WHILE ;
    Commit ;
END //
DELIMITER ; -
Kafka Instance: Running in Docker, allocated memory is 48GB.
Test Results:
| Target Database | Incremental Rows Written | Total Increment Time | Average Sync RPS | 99th Latency | 95th Latency | Average Latency |
|---|---|---|---|---|---|---|
| MySQL | 5 million | 281 seconds | 17,795 | 1,400 ms | 1,200 ms | 712 ms |
| Kafka | 2 million | 184 seconds | 10,892 | 1,100 ms | 1,100 ms | 690 ms |
Source Database: PostgreSQL
Environment Description
In this test, the PostgreSQL instance is deployed in Docker with 48GB of available memory, with no indexes other than CUSTOMER_ID. Incremental log information is obtained using WAL2JSON, and the table structure is as follows:
CREATE TABLE customer (
   CUSTOMER_ID bigint PRIMARY KEY,
   CITY VARCHAR(100),
   AGE INT,
   FIRST_NAME VARCHAR(150),
   LAST_NAME VARCHAR(150),
   DATE_OF_BIRTH TIMESTAMP,
   JOB VARCHAR(150),
   EMAIL VARCHAR(100),
   ZIP VARCHAR(10),
   PHONE VARCHAR(40)
);
Data will be continuously inserted using a custom PostgreSQL function to simulate incremental data generation, inserting approximately 10,000 rows per second:
CREATE OR REPLACE FUNCTION CUSTOMER_INSERT_DATA6(DATA_COUNT INT, BATCH_SIZE INT) RETURNS VOID AS $$
DECLARE
    i INT := 1;
    MAX_ID INT;
BEGIN
    SELECT MAX(CUSTOMER_ID) FROM customer6 INTO MAX_ID;
    IF MAX_ID IS NULL THEN
        MAX_ID := 0;
    END IF;
        WHILE i <= DATA_COUNT LOOP
                INSERT INTO customer6 (CUSTOMER_ID, CITY, AGE, FIRST_NAME, LAST_NAME, DATE_OF_BIRTH, JOB, EMAIL, ZIP, PHONE)
                VALUES (MAX_ID+i, 'Oppenheim', 18, 'Lambert', 'Sauer', CURRENT_TIMESTAMP, 'Vertreter / Vertreterin', 'rushland2003@live.com', '13480', '+49-4611-41132053');
                i := i + 1;
        END LOOP;
END;
$$ LANGUAGE plpgsql;
Test Results
| Target Database | Incremental Rows Written | Total Increment Time | Average Sync RPS | 99th Latency | 95th Latency | Average Latency |
|---|---|---|---|---|---|---|
| PostgreSQL | 1.45 million | 121 seconds | 11,946 | 1,600 ms | 1,500 ms | 1,060 ms |
Source Database: Redis
Environment Description
In this test, the Redis instance is deployed as a 3-node cluster, each node having 4 cores and 16GB of memory. An automation script will perform data insertion operations at a rate of 30,000 rows per second. Key structure is shown below:
9000) "8273618"
9001) "7690169"
9002) "1854874"
Test Results
| Target Database | Incremental Rows Written | Total Increment Time | Average Sync RPS | 99th Latency | 95th Latency | Average Latency |
|---|---|---|---|---|---|---|
| Redis | 29.4 million | 1806 seconds | 16,287 | 800 ms | 200 ms | 140 ms |